
by Australian Energy Council
NEM generation profile 2022-23
The Australian Energy Regulator's (AER) 2023 State of the Energy Market highlights the generation mix across the National Electricity Market (NEM) as well as emerging trends. We take a look at what key developments occurred in the generation mix and how they impacted price trends throughout the 2022-23 financial year.
Generation
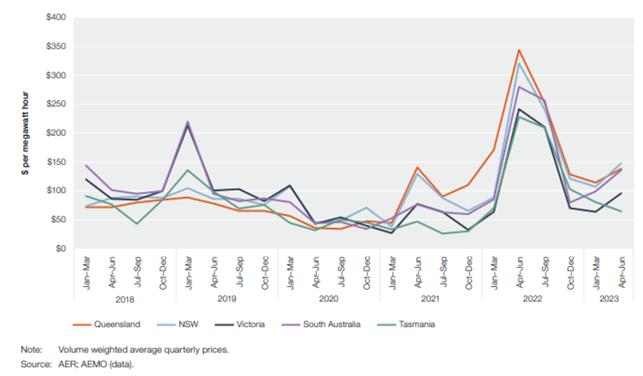
The AER State of the Market Report notes that prices rose across all regions of the NEM in the 2022-23 financial year. The rise has been attributed to higher prices experienced in the July to September 2022 Quarter. Here are the wholesale market trends on a state-by-state basis:
- Queensland ($157 per MWh) remained the NEM’s highest priced region in 2022–23, however it is the only region that decreased its average price year on year. The AER figures provided were rounded, however do note that Queensland was $0.11 higher than NSW.
- NSW ($157 per MWh) remained the NEM’s second highest priced region in 2022–23, with prices increasing 9 per cent overall. While prices were significantly elevated in the July to September quarter, prices were 39-55 per cent lower in all subsequent quarters.
- South Australia ($150 per MWh) prices increased 20 per cent in 2022–23. South Australia experienced interconnector problems throughout the financial year, and consequently its ability to import supply from Victoria in times of low wind output. While the state regularly experiences negative prices in the middle of the day when wind and solar output are high, it experienced more individual high price events as a result of import issues raising its average price to $150 per MWh.
- Tasmania ($117 per MWh) was the NEM’s second-lowest priced region in 2022–23, having previously been the lowest priced region since 2019-20. Due to a lower level of installed renewables, prices did not go as low as other regions in the summer months.
- Victoria ($114 per MWh) saw an increase of 10 per cent from its average price in 2021–22 but replaced Tasmania to become the NEM’s lowest priced region. Prices remained lower as a result of lower week-to-week price volatility experienced across the rest of the NEM.
Figure 1 – Quarterly wholesale electricity prices
In 2022, the wholesale market recorded the highest ever spot prices. These records have been covered extensively elsewhere. We begin to look at the market in Spring 2022, where wind and solar generation increased and planned and unplanned plant outages decreased across the wider market.
In December 2022, state and federal governments intervened in coal markets to cap the price of coal being sold to generators at $125 per ton in NSW and QLD. The federal government also intervened in the gas market, capping prices at $12 per GJ.
In the same period that intervention was flagged, the Australian Energy Council published another Energy Insider which posed the overall question “Have high prices already cured high prices?”
The piece opined:
“Gas, coal and electricity prices across the world, and in Australia, took a major correction downwards in September and October from historically high levels, a trend that could well continue. Regardless of your view on the merits of intervention, it seems the time for it is now behind us, and the best thing now would be to wait and watch how this correction pans out.”
However, governments persisted with intervention and market prices were ultimately capped.
In February 2023, answering its earlier question, the AEC published a further comprehensive analysis piece which stated, “High prices cured high prices.”
Through a thorough analysis of market prices and trends, the piece concluded:
“…it is much harder to establish whether the government interventions have provided any actual differences to what prices would have been had existing downward trends been allowed to continue. Especially when one considers the massive price declines in global gas and coal markets. Simple laws of economics suggest high prices in a competitive market will encourage more supply and dampen demand.”
The AER report lists a number of additional market factors that contributed to prices in 2022-23.
Fuel availability was more consistent for coal generators as coal mines and coal rail freight lines were not closed due to extreme wet weather and flooding as they were in 2022. The AER also notes the higher availability of gas plants, which provided more supply to the market in 2022-23, putting downward pressure on prices.
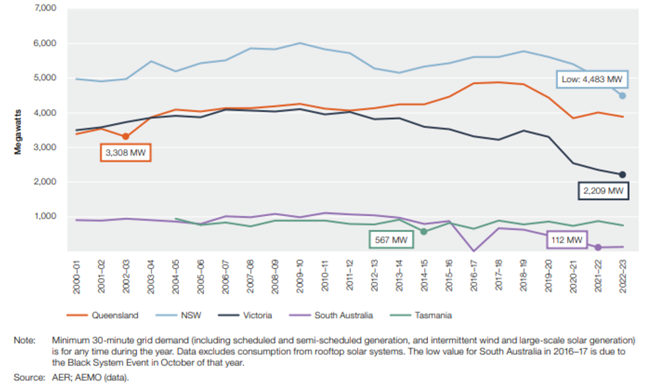
Minimum and maximum grid demand
Rooftop solar output continued to grow throughout 2022-23, further reducing grid demand in the middle of the day when the sun is shining. The AER report notes that a number of rooftop solar output records were set in the year. The high mark was set on 11 February 2023, when rooftop solar achieved a total output of 11,504MWh. The trend towards greater solar output across the NEM lead to all regions recording below-average minimum demand events as can be seen below in Figure 2.
Figure 2 – Minimum grid demand
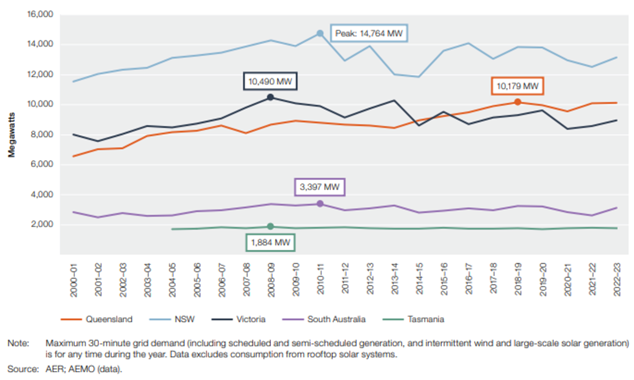
Maximum grid demand levels rose in all regions of the NEM except Tasmania in 2022-23. Maximum demand occurred several times in the January to March quarter between 5:30pm and 7pm on days when the temperature was above 35 degrees Celsius in capital cities. The growth in maximum grid demand can be seen in the graph below, with the peak demand figures highlighted by state/region.
Figure 3 – Maximum grid demand
Generation output by fuel source
The AER’s latest data provides a breakdown of the generation sources in use across the NEM and the contribution each form of generation makes to the grid in MWs (registered capacity). The AER also provides the generation mix for each state in a separate graph.
A comparison of the two sets of graphs highlights the differences between the capacity factors of different technologies. Very broadly speaking, variable renewable energy (VRE) such as large scale solar and wind have capacity factors in the order of around 29 percent and 45 per cent noting that location is a major determinant of what the capacity facts will be. Rooftop solar has a capacity factor of around 14 per cent with one reason for the capacity difference between rooftop and utility scale solar being that utility scale solar has panels that track the sun.
In contrast to VRE, coal plant operates at much higher capacity factors (ie, baseload) and has minimum levels that plant can be operated at. Peaking gas plant can be operated at similar capacity factors as coal, but in practice they run at relatively low capacity factors and this is determined primarily by prices and fuel costs and/or contract positions.
The report notes that 23 per cent of grid generation is provided by rooftop solar (18,012MW). This is significant as rooftop solar has become the most common form of generation in the NEM, overtaking black coal for the first time due to both the closure of Liddell and trending increases in rooftop solar installations.
Following Liddell’s closure, the AEC produced analysis which noted:
“While there was concern about the potential impact on power prices with the closure, the absence of the plant will already have been factored into future contract prices. There was no real movement in CAL2024 contract wholesale prices during April and certainly no upward movement. In fact the price at the end of April was $131.91/MWh compared to $136/MWh on 3 April.”
Further, the AEC concluded:
“As the energy shift continues Liddell won’t be the last major headline that is created. There will undoubtedly remain major challenges and nervous moments to be managed and we are likely to continue to see a political urge to step into the market. But if the closure of Liddell has shown anything, it is that above all the noise the market will continue to respond to operational changes.”
Figure 4 - Generation capacity, by fuel source
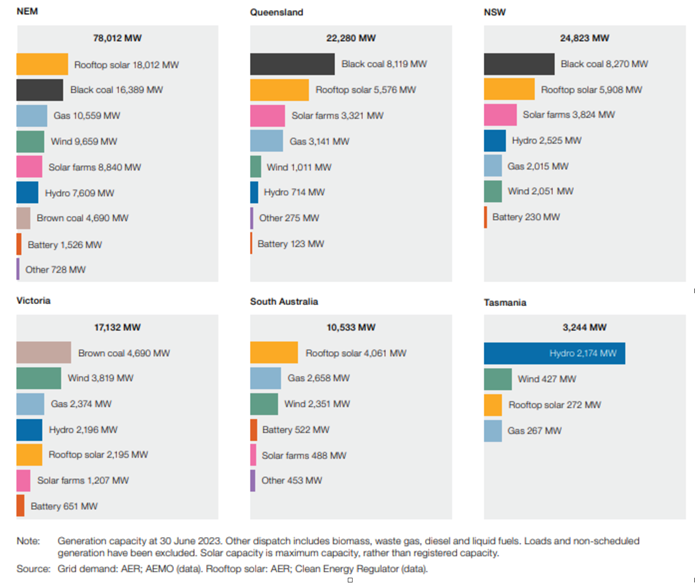
Figure 5 - Generation output, by fuel source *click to view larger image here 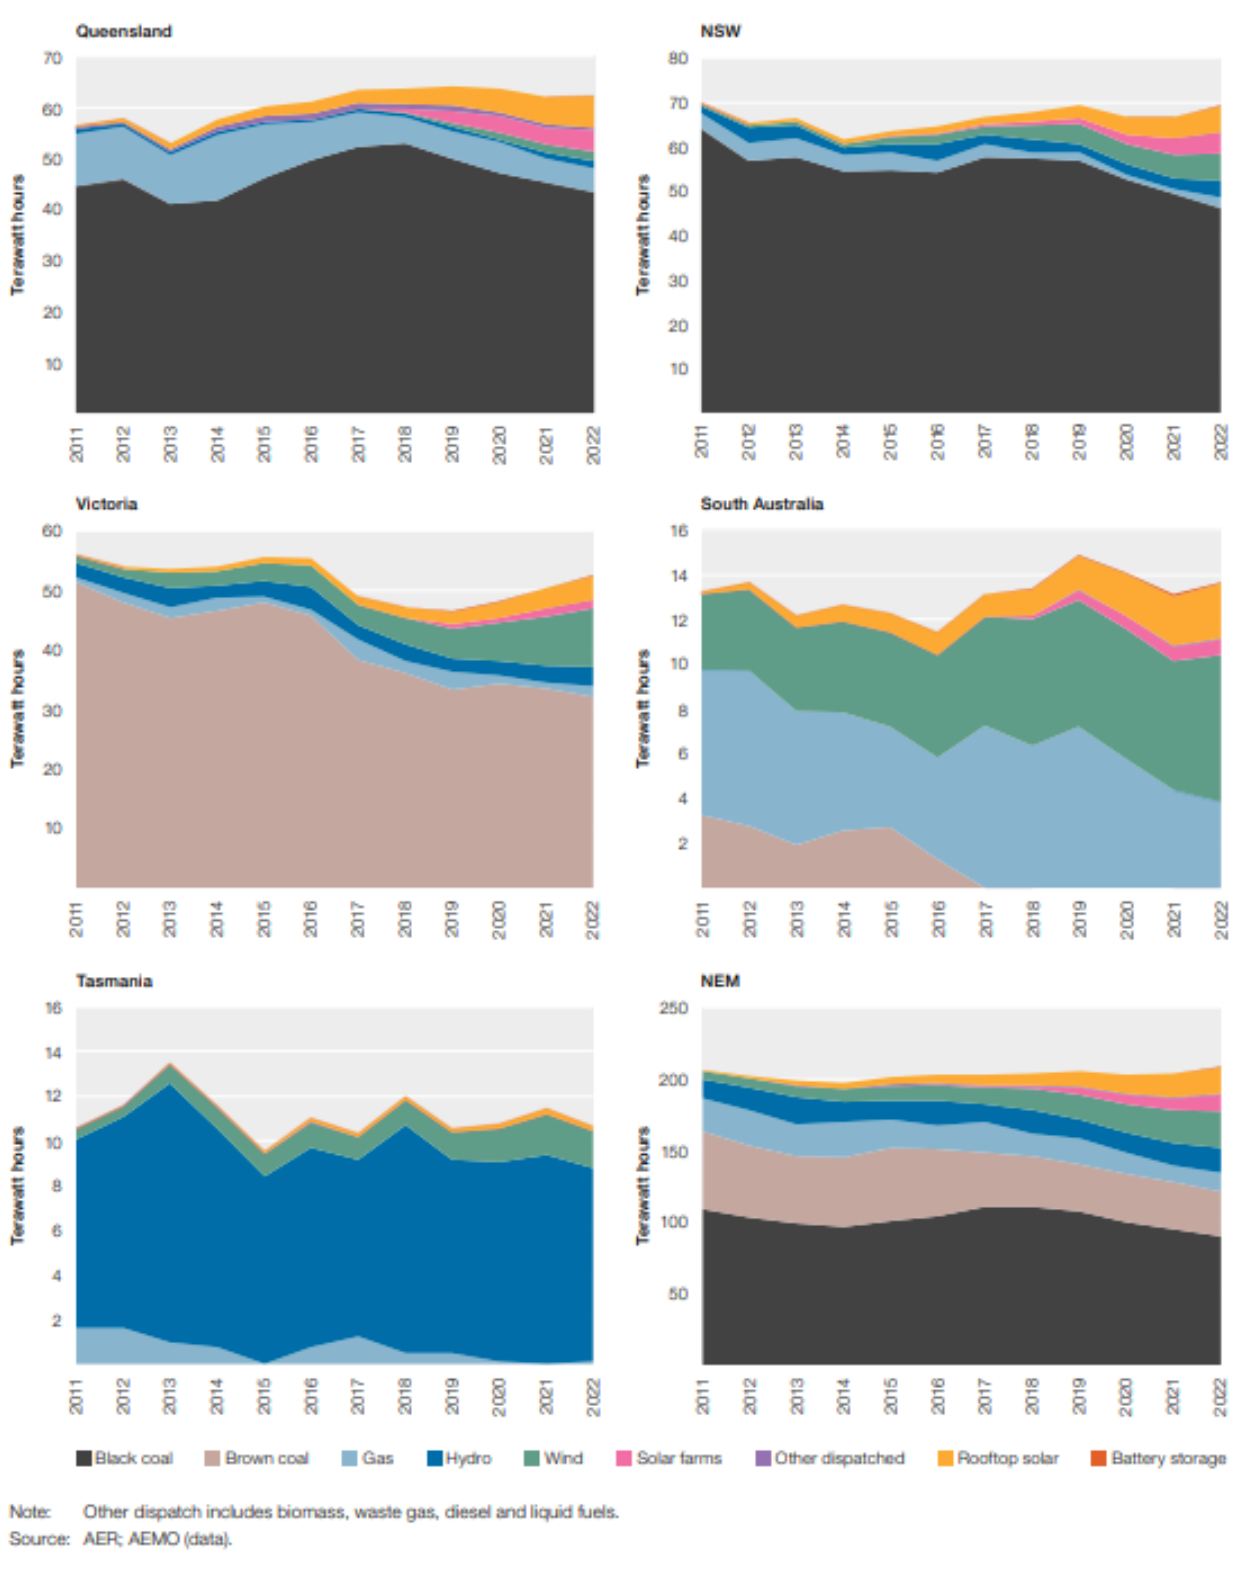
Related Analysis
Wild Cards: Could these technologies advance the energy transition?
In December 2022, scientists at the National Ignition Facility achieved a landmark nuclear fusion result: a reaction that produced more energy than the laser pulse used to start it. It made headlines globally, but the caveats came quickly. Overall system energy use was still far higher, and commercial viability remains decades away. It was a real breakthrough, but also a reminder of how far the engineering still has to go. That gap between scientific progress and commercial reality is a defining feature of the energy transition today. While solar, wind, and batteries are scaling rapidly and doing most of the heavy lifting, the International Energy Agency estimates that nearly half of the emissions reductions needed for net zero will depend on technologies still at demonstration stage or earlier. This raises the key question: which “wild card” technologies could help close that gap?We take a look.
Integrated System Plan – What Should We Expect?
The release of an expert study of last year’s autumn wind drought in Australia by consultancy Global Power Energy[i] this week raised some questions about the approach used by the Australian Energy Market Operator’s in its 2024 Integrated System Plan (ISP). The ISP has been subject to debate before. For example, there has previously been criticism that some of the ISP’s modelling assumes what amounts to “perfect foresight” of wind and solar output and demand[ii], rather than a series of inputs and assumptions. The ISP is produced every two years and with the draft of the next ISP (2026) due for release soon, it is useful to consider what it is and what it is not, along with what the ISP seeks to do.
Nuclear Fusion Deals – Based on reality or a dream?
Last week, Italian energy company ENI announced a $1 billion (USD) purchase of electricity from U.S.-based Commonwealth Fusion Systems (CFS), described as the world’s leading commercial fusion energy company and backed by Bill Gates’ Breakthrough Energy Ventures. CFS plans to start building its Arc facility in 2027–28, targeting electricity supply to the grid in the early 2030s. Earlier this year, Google also signed a commercial agreement with CFS. These are considered the world’s first commercial fusion-power deals. While they offer optimism for fusion as a clean, abundant energy source, they also recall decades of “breakthrough” announcements that have yet to deliver practical, grid-ready power. The key question remains: how close is fusion to being not only proven, but scalable and commercially viable, and which projects worldwide are shaping its future?
Send an email with your question or comment, and include your name and a short message and we'll get back to you shortly.