
by Carl Kitchen & Blaine Wang
International electricity prices: How does Australia compare?
Australian retail household electricity prices in the National Electricity Market (NEM) are the lowest they have been for eight years, and on an international comparison are the 10th lowest of the 38 OECD countries.
The average cost per unit of electricity has fallen to 27 cents/kWh according to the most recent Australian Competition and Consumer National Electricity Market (NEM) data. When compared against other countries using a purchasing power exchange rate, Australian average prices per kilowatt-hour are equivalent to 17.6 US cents (c/kWh), well below the OECD average cost of 24.2 US c/kWh and less than many European countries.
Purchasing power parity (PPP) is used to adjust the data to exchange rate differences and ensures a like-for-like comparison when buying an equivalent good or service across borders, therefore PPP can provide a good indication of affordability by country.
Shown in figure 1, the highest household cost of electricity on a PPP basis is Germany, the Czech Republic, and Poland, while the cheapest residential electricity rates are seen in Canada, Iceland, and Norway.
Figure 1: Household electricity prices - PPP adjusted (USD) *view larger image here
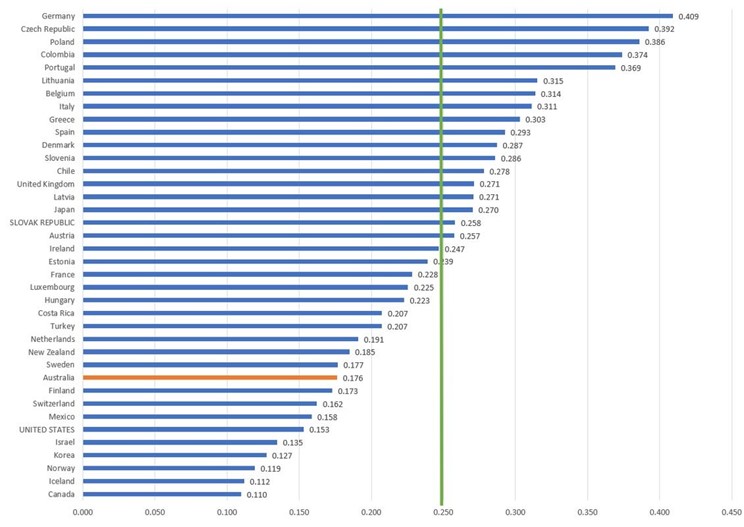
Source: AEC analysis of OECD country data. Green line represents OECD average. Note: The Australian price is based on the ACCC’s average residential price of 27 c/kWh.
Without the PPP adjustment, Australian residential electricity prices are at 19.21 US c/kWh, just below the OECD average (19.8 US c/kWh, see figure 2).
Figure 2: Household electricity prices OECD (USD) *view larger image here
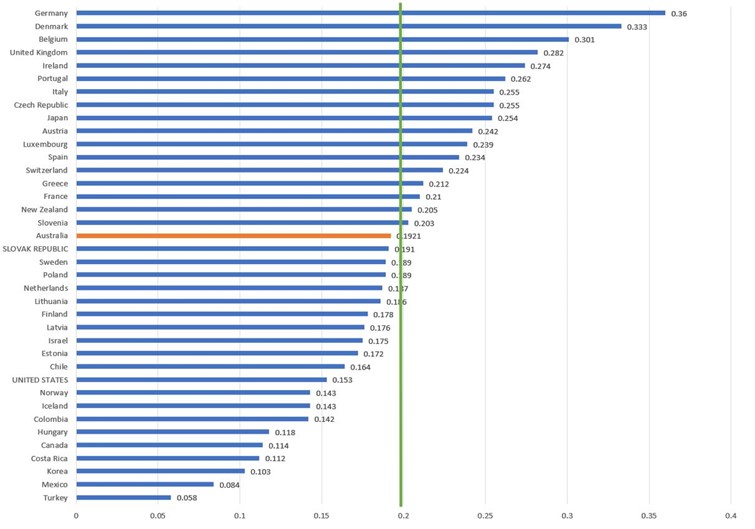
Source: AEC analysis of OECD country data. Green line represents OECD average.
Australia’s current prices are below what we reported from 2014 when we undertook an international comparison. Then, they were 20.47 US c/kWh (PPP) and lower than the OECD average of 23.03 US c/kWh.
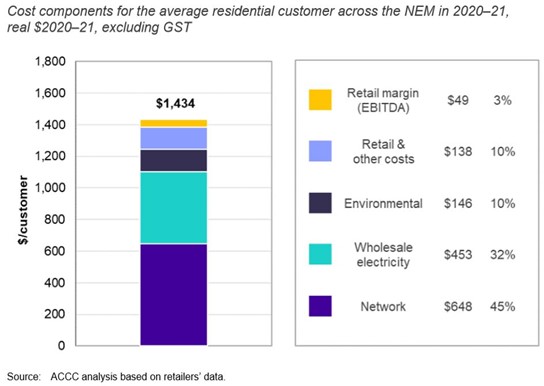
Our latest assessment against international prices is consistent with the ACCC’s most recent findings on prices in the NEM, which were released just before Christmas 2021 and found residential electricity bills were at eight-year lows. The average annual cost of electricity per residential customer in 2020–21 was $1,434, down by $128 (or 8 per cent) compared to 2018–19. All cost components except environmental costs decreased in the last two years, with the largest fall being in wholesale electricity costs (down by $67).
Figure 3: Annual cost to supply an average residential customer
The ACCC noted the cost to supply electricity in the NEM is 32 per cent higher in 2020–21 compared to 2007–08. The electricity inflation index was 63.1 in 2007-08 and 125.7 in 2021. Overall, the Consumer Price Index increased from 89.8 in 2007-08 to 118.8 in 2021.
Figure 4: Electricity and all group CPI Index *view larger image here

Source: AEC analysis of ABS data
Overall customers are seeing the benefits of lower wholesale prices. Wholesale price reductions were the primary driver of costs reductions in the past two financial years, the result of increased renewable generation coming into the system as well as lower fuel costs for coal and gas generation and lower demand due to factors like the impact of COVID on economic activity, milder weather in some areas and growth in household rooftop solar.
Those lower costs are reflected in retail costs over time and as retailers enter new wholesale contracts. Retailer operating costs also fell and retailer margins are at low levels according to the ACCC analysis. The ACCC also notes that over the past seven years network costs have gradually declined.
In contrast the cost of government reforms and environmental schemes are increasing. The cost of the small-scale renewable certificates scheme, which runs through to 2030, has risen reflecting the unprecedented uptake of rooftop solar installations. Environmental costs also include the large-scale renewable energy target, and state-based solar feed-in tariff schemes and renewable targets.
The cost of government reforms were also recently highlighted by increased costs to ACT residents. On 1 July last year, the cost of funding the ACT’s renewable energy target jumped by 133 per cent to $153 million. For an average Canberra household the cost of various 100 per cent renewables policies rose from $176 last year to $423 in this year.
There are some wholesale cost pressures in parts of the NEM beginning to emerge with the market operator pointing to a gap between higher average wholesale prices in Queensland and New South Wales. Factors include increases in underlying traded prices for black coal and gas.
Business prices
For business customers, OECD data shows Australia ranked 14th lowest out of the 35 member countries reported (figure 5).
This is slightly above costs to US business (12.3 US c/kWh versus 12 US c/kWh), but well below the costs in other major economies such as Germany (25.5 US c/kWh), the United Kingdom (23.8 US c/kWh), Italy (21.3 US c/kWh) and Japan (19 US c/kWh).
Figure 5: Electricity prices – business OECD (USD) *view larger image here
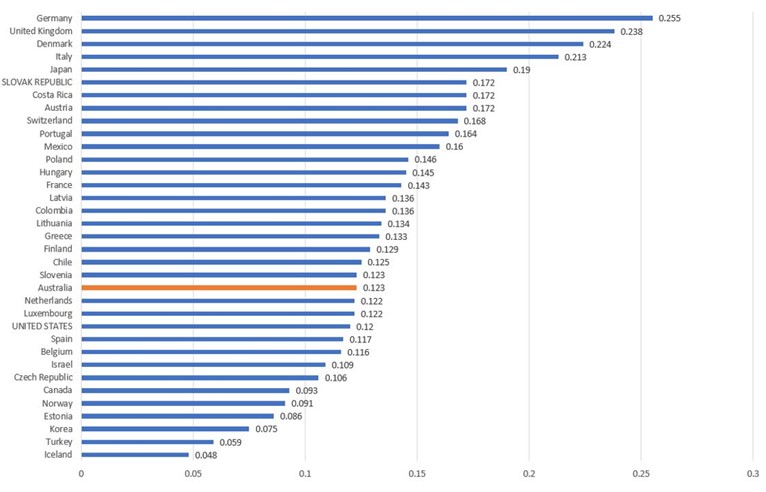
Source: OECD
Top to bottom: International factors
Electricity prices vary from country to country depending on factors like infrastructure costs, government, energy and climate policies, local energy resources and the generation mix.
The highest cost countries for household power bills in our analysis are Germany, the Czech Republic and Poland.
Germany has set an ambitious decarbonisation target for its electricity sector, and more than half of its electricity prices are the result of government-imposed charges including taxes, levies, and surcharges. Its renewable energy surcharge pays a state-guaranteed price for renewable energy to producers and was 6.5 c/kWh in 2021 but is expected to fall to 3.72 c/kWh this year.
The Czech Republic’s generation mix is dominated by fossil fuels, particularly coal. One factor cited for higher prices is the European Commission’s carbon emission reduction plans.
Coal generation is also a major contributor to Poland’s electricity supply; in 2020 power prices increased faster than in any other European Union (EU) country. Poland relies on coal for around 70 per cent of its electricity generation and due to “inefficient production” and EU environmental policies, this has led to a steady rise in the price of electricity in recent years.
European countries have also been contending with higher gas prices pushed up by low stocks and high demand in Asia.
Canada, Iceland, and Norway ranked as the lowest cost countries. Most of lower cost nations are dominated by hydroelectricity plants. Canada sources most of its electricity from hydro (60 per cent), followed by nuclear (13.5 per cent) and gas power plants (11.26 per cent) where it can draw on domestic gas supplies.
Iceland sources its electricity from hydro (73 per cent) and geothermal (27 per cent), while Norway sources nearly all its electricity needs from hydro sources (around 93 per cent).
South Korea, which also has low residential electricity prices, is an exception amongst the lower cost countries. While South Korea is heavily dependent on fossil fuel generation and fuel imports, it also has regulated prices with a fixed-rate and low taxes, which have kept household bills lower. But this may be changing, as the state-owned monopoly Korean Electric Power Corporation increased its rates for the first time in eight years due to the increasing fuel costs from LNG and coal. Flexible electricity rates were adopted and linked to global fuel prices starting in 2021, in a move to improve its profitability.
Related Analysis
Network Tariff Reform: From Cost Recovery to Coordination in a High-CER System
Network tariff reform has shifted from a technical pricing issue to a central challenge for Australia’s future energy system, shaping affordability, market design and the transition to a customer-centric grid. Recent modelling by the Australian Energy Market Commission provides a timely and valuable contribution to this debate, with one of the most consequential ideas in its Pricing Review reform package being Recommendation 6—proposing that networks develop tariffs for retailers, rather than directly for end-use customers. We take a closer look at the implications.
Addressing Energy Affordability Needs More Than Short-Term Relief
The conflict in the Middle East has continued to highlight the challenges we face in ensuring energy supply remains accessible and affordable for everyone. Ensuring Australia becomes more resilient to international energy price shocks will dominate the energy policy landscape for some time, and rightfully so. But while political debate often gravitates toward regulatory interventions and subsidies that deliver short term household bill relief, the real solution lies in something far more complex: reshaping how the energy system works for consumers. What’s increasingly clear is that energy affordability is not just about price - it’s about design. That is why the AEC is releasing its Affordability Action Agenda today – an 8-point plan of critical actions that industry and governments need to take to ensure that energy remains accessible and affordable for all Australians. Read more.
Efficient Pricing in an Uncertain Energy Market
Electricity prices are once again front of mind for Australians, and with cost-of-living pressures mounting, expectations for fair and transparent pricing are entirely reasonable. But as reforms to the Victorian Default Offer and Default Market Offer evolve, a more complex challenge emerges: how to keep prices in check without undermining the stability, competition and investment needed to sustain the energy system over time. Striking that balance is at the heart of current reform debates, and will ultimately determine whether today’s affordability measures support or weaken the system in the long run. Read more.
Send an email with your question or comment, and include your name and a short message and we'll get back to you shortly.