

by Carol Tran
Worldwide electricity prices: How does Australia compare?
Electricity prices across countries around the world vary due to factors like infrastructure maintenance, government energy and climate change policies, local energy resources and diversity in generation assets. As reported in the Energy in Australia 2015 report, Figure 1 shows electricity prices in 2014 from leading economies worldwide. As can be seen, Australia’s power prices, (at equivalent purchasing power exchange rates) were lower than the OECD average of 23.03 US cents per kilowatt-hour (c/kWh). At 20.47 US c/kWh Australian 2014 electricity prices are also low by overall international standards.
Figure 1: OECD household electricity prices, PPP measure 2014
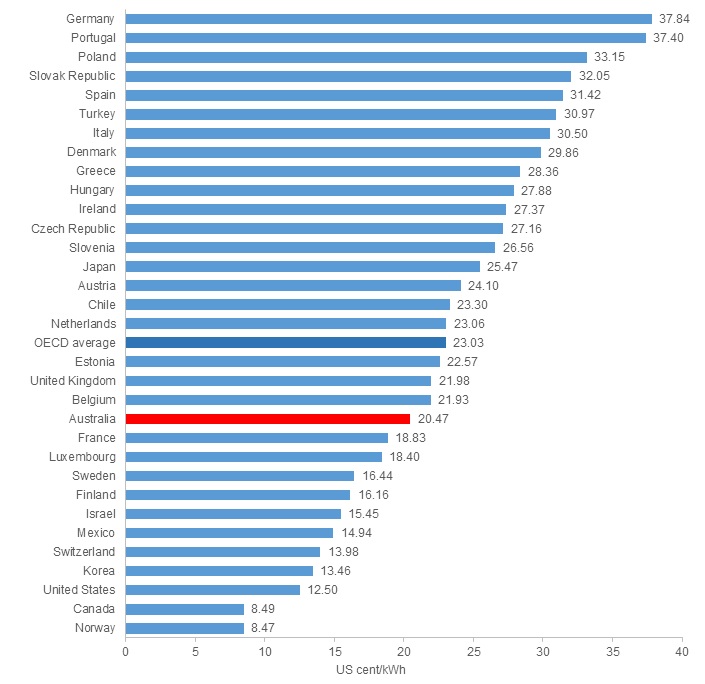
Purchasing power parity (PPP) is used to adjust the data to exchange rate differences and ensures a like-for-like comparison when purchasing the equivalent quantity of goods or services in all countries[i].
From this comparison, electricity for household consumers was the most expensive in Germany, Portugal, and Poland, while it was cheapest in the United States, Canada and Norway. There was a significant gap of around 29 US c/kWh between the least and most expensive power prices.
Figure 2: Portion of a day's wages needed to buy the average day of electricity usage [i]
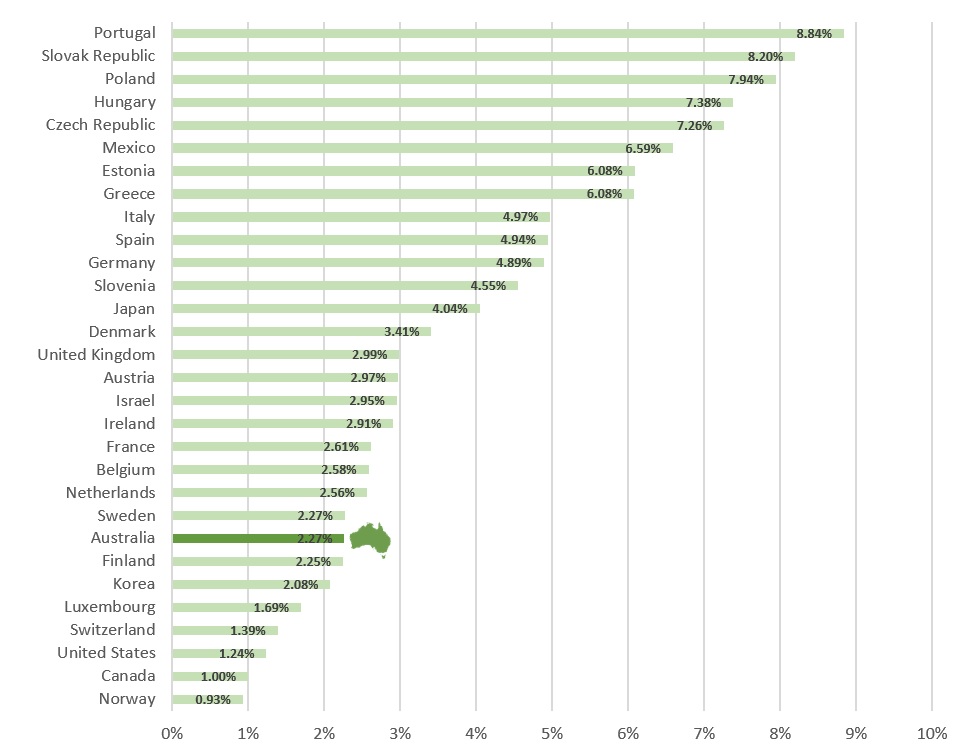
Source: OECD website
The average day of electricity usage is 15.52kW, according to Electricity Gas Australia 2015.
Figure 2 shows the amount of a day’s wage to cover the cost of an average day’s electricity consumption. The figure uses average annual wages in US dollars (on a PPP basis) to calculate an affordability rate for electricity.
As shown in Figure 2, Australians use only 2.27 per cent of their daily wages to meet their power bills with the average daily income calculated at US$140.13. This is amongst the best affordability ratings when compared to the other 29 countries shown.
Affordability is a bigger challenge in European nations. The Portuguese, for example, had to use 8.84 per cent of their daily wage to meet their power bills. And while Germany has the highest electricity prices (Figure 1), given its higher average annual salary levels, the daily household electricity bill only accounts for 4.89 per cent of a day’s wages.
Recent Australia household electricity prices
Figure 3: Australian residential electricity price trend
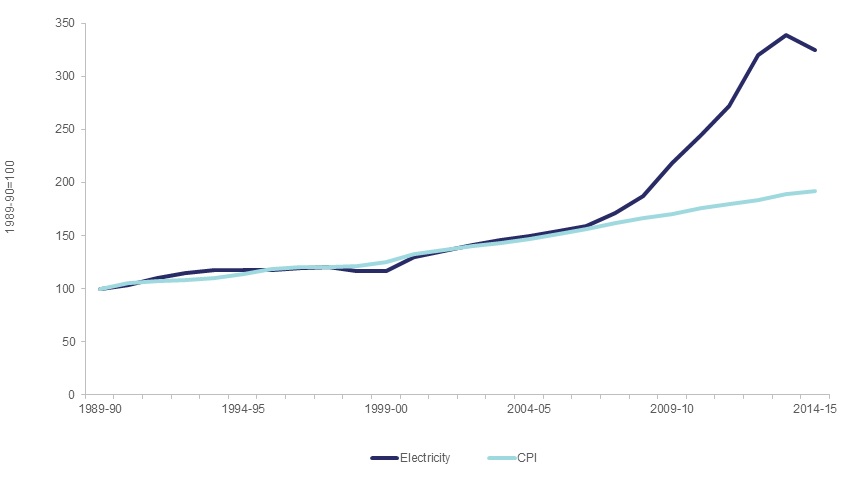
Source: ABS (2015) cat no 6401, Consumer Price Index, Australia
While Australia enjoys relatively low electricity prices in comparison to other countries, over the 2004-2014 period, retail electricity prices for households nearly doubled. Increases were largely caused by the need to invest in network infrastructure due to the need to replace aging assets[ii]. Residential electricity prices fell in 2014/15 following the abolishment of the Australian Government’s carbon tax.
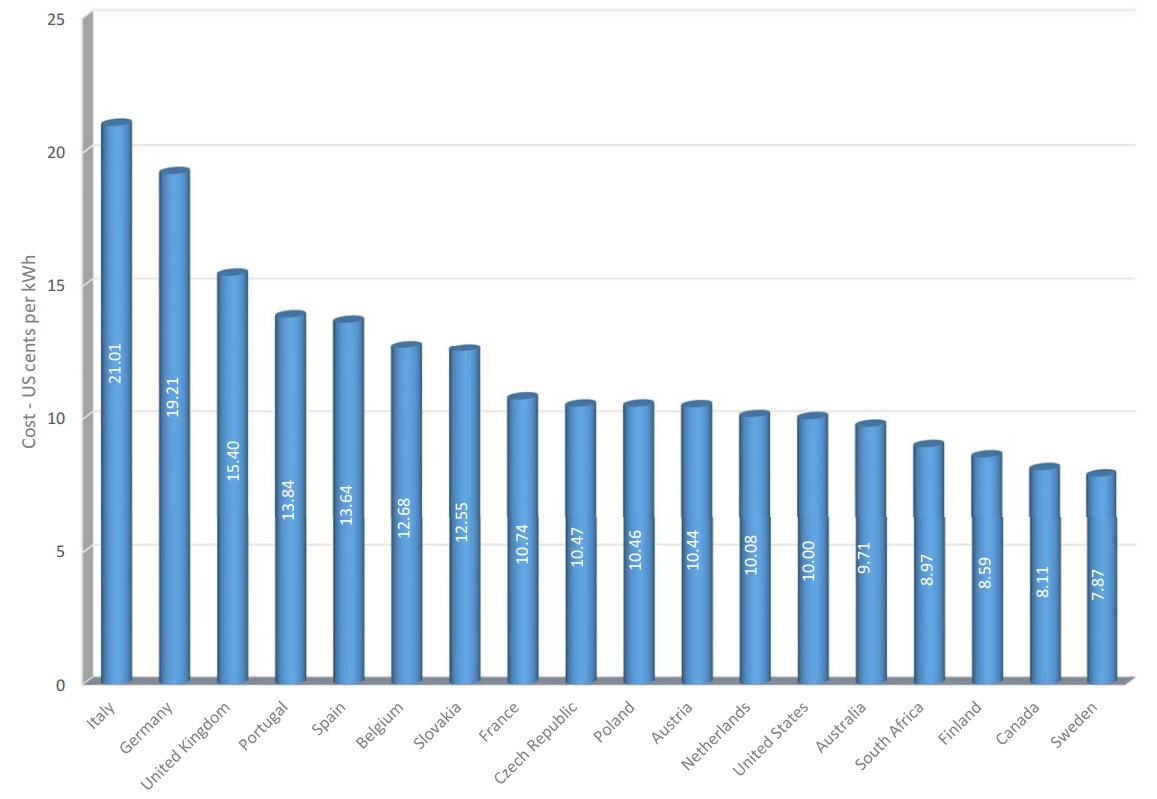
Industrial prices
Industrial prices are important for the competitiveness of energy-intensive businesses. International consulting group NUS has carried out a survey of industrial prices (which are based on individual contracts and so not necessarily publicly disclosed) for many years. The repeal of the carbon price has returned Australia to the lower end of the 18 surveyed countries, after two years amongst the more expensive countries. Industrial prices are more sensitive to wholesale prices than household tariffs.
Figure 4: Industrial prices, NUS Group, 2013-14 International Electricity and Natural Gas Report and Price Survey
Related Analysis
Addressing Energy Affordability Needs More Than Short-Term Relief
The conflict in the Middle East has continued to highlight the challenges we face in ensuring energy supply remains accessible and affordable for everyone. Ensuring Australia becomes more resilient to international energy price shocks will dominate the energy policy landscape for some time, and rightfully so. But while political debate often gravitates toward regulatory interventions and subsidies that deliver short term household bill relief, the real solution lies in something far more complex: reshaping how the energy system works for consumers. What’s increasingly clear is that energy affordability is not just about price - it’s about design. That is why the AEC is releasing its Affordability Action Agenda today – an 8-point plan of critical actions that industry and governments need to take to ensure that energy remains accessible and affordable for all Australians. Read more.
Efficient Pricing in an Uncertain Energy Market
Electricity prices are once again front of mind for Australians, and with cost-of-living pressures mounting, expectations for fair and transparent pricing are entirely reasonable. But as reforms to the Victorian Default Offer and Default Market Offer evolve, a more complex challenge emerges: how to keep prices in check without undermining the stability, competition and investment needed to sustain the energy system over time. Striking that balance is at the heart of current reform debates, and will ultimately determine whether today’s affordability measures support or weaken the system in the long run. Read more.
The Shadow of the Safety Net: Who Pays for Fairness?
Fairness is a defining Australian value, and it sits at the heart of Victoria’s Getting to Fair strategy aimed at improving equity in essential services. While the Australian Energy Council strongly supports helping people in vulnerable circumstances, funding social equity programs through energy bills risks creating hidden cross-subsidies that place additional pressure on households already struggling with affordability. We take a look at why a more transparent, tax-funded model, combined with retailers acting as delivery partners, may provide a more sustainable and genuinely fair pathway to supporting vulnerable customers.
Send an email with your question or comment, and include your name and a short message and we'll get back to you shortly.