

by Carl Kitchen
Electricity does heavy lifting on emissions reductions
The Federal Government unveiled its net zero emissions by 2050 target this week and along with it the latest projections for economy-wide emissions.
The report - Australia’s Emissions Projections 2021 - shows the heavy lifting that has occurred from the electricity sector and flags the continued leading role the sector will play in reducing the country’s greenhouse gas output. But it also reveals, fairly starkly, that more will need to be done by other sectors if Australia is to reach its 2050 target.
The speed of the transition underway in the energy sector is impressive and, as a result, carbon emissions from electricity in Australia are now expected to more than halve from 179Mt in 2019 to 88Mt in 2030. In the National Electricity Market (NEM) in the same period, emissions will fall 57 per cent to 64Mt in 2030 (compared to 150Mt in 2019). And in just the five years from 2025 there is forecast to be a 36 per cent drop in NEM emissions - in the previous emission projections the reduction was expected to be around half that amount (17 per cent) for the same period.
Electricity sector emissions will be 55 per cent below the 2005 baseline (197Mt) in 2030 (88Mt) and will account for just 20 per cent of Australian emissions at that time (down from 34 per cent in 2019). If achieved it will be a reduction in total electricity emissions of around 91Mt, which includes an 86Mt drop in NEM emissions, between 2019 and 2030. Under the baseline scenario Australia is expected to achieve a 30 per cent reduction on 2005 levels by 2030 and between 2019 and 2030 total emissions are expected to fall 17 per cent or by 90Mt (see figure 4).
Figure 1: Electricity emissions, Mt CO2-e
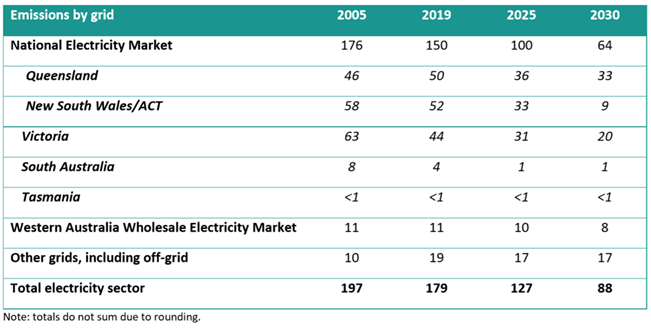
Source: Australia’s Emission Projections 2021, Dept of Industry, Science, Energy and Resources
New South Wales and the ACT electricity emissions are projected to fall a remarkable 49Mt from 2005 to 2030 (from 58Mt to 9Mt) while Victoria’s emissions are expected to fall to 20Mt in 2030 (from 63 in 2005).
New South Wales increased its emissions target to 50 per cent (up from 35 per cent on 2005 levels by 2030) this year, based on updated projections and objectives for its Net Zero Plan. Victoria enshrined emission reductions in its Climate Change Act 2017, which requires five interim targets to reach net zero by 2050. It has set an interim target for 2021–2025 of a 28–33 per cent reduction below 2005 levels by the end of 2025. And an interim target of 45-50 per cent below 2005 levels by the end of 2030 (previously covered here).
Emissions in Western Australia’s Wholesale Electricity Market (WEM) are expected to fall by 3Mt between 2019 and 2030, as more renewables enter that grid. Emissions in the Darwin Katharine Interconnected System (DKIS) are also projected to decrease by less than 1Mt in the same period, as more large and small-scale solar comes into the system, along with an estimated 420MW of battery storage also entering the grid to manage the challenge from a lack of variety in the Territory’s renewable sources.
Carbon emissions from off-grid electricity are expected to remain around current levels by 2030, but emissions from electricity supplied to mining and remote communities is projected to fall by 1Mt. In contrast emissions from LNG production is expected to increase by 1Mt over the decade to 2010.
Renewables: A key factor
Unsurprisingly the fall in emissions is largely driven by the faster than expected uptake of renewable generation, as well as the expectation that strong growth in renewables still has some way to go.
The retirement of coal-fired plants has (and will) also played a significant role with more than 4300MW closed since 2012. The 2000MW Liddell Power Station is expected to close its first unit in 2022 and the remaining three in 2023, and the 1480MW Yallourn Power Station will close in 2028. In the WEM units at the Muja power station are expected to close from 2022.
The emission projections assume 11GW of coal-fired capacity will retire between 2019 and 2030 and leave 14GW of installed capacity. There is currently 23GW of coal-fired capacity in the NEM and more than 1600MW in the WEM.
The Australian Energy Market Operator (AEMO) has previously forecast 11GW of capacity will retire in Queensland and New South Wales between 2028 and 2038. Those closures would leave Mount Piper in NSW (1320MW) and Loy Yang A and B in Victoria (3120MW) in the NEM outside Queensland. Despite plant closures, coal fired generation remains the dominant supply source in the NEM.
In particular, the strongest growth in renewable generation is projected to come from New South Wales. Renewable generation is forecast to increase from 46 per cent of the state’s generating capacity in 2025 and reach 84 per cent in 2030. In 2019 renewables accounted for just 16 per cent of the New South Wales generation fleet – the second lowest in the NEM just ahead of Queensland with a 12 per cent share. This reflects the anticipated major impact of the New South Wales Electricity Infrastructure Roadmap and the emissions projections are now forecasting just 9Mt for 2030 emissions in the state, which is consistent with only one 1400MW coal plant in historical operating mode.
Also of note is South Australia’s energy system - by 2030 the state’s generating capacity will be almost entirely in the form of renewables (96 per cent) up from an already strong 53 per cent in 2019.
As a result, renewables are predicted to represent 69 per cent of the NEM’s generation capacity by 2030 and 61 per cent of Australia’s total installed capacity. This is a dramatic shift from current capacity levels and expected to be achieved in a very short timeframe of nine years. The emissions projections report shows renewable capacity represented 23 per cent of the NEM’s capacity and 21 per cent nationally in 2019, and that marked an impressive increase from just 9 per cent nationally in 2005. The projected level of renewables penetration is also well ahead of the most aggressive scenario “Step Change” outlined in the AEMO’s 2020 Integrated System Plan.
Rooftop solar is expected to be the largest contributor to new renewable capacity with the Clean Energy Regulator’s projections for rooftop solar showing strong adoption to 2026 when the cumulative total installed capacity is expected to reach 27GW (up from around 15GW currently). By 2030 a tripling in capacity in the NEM is projected to push the cumulative rooftop solar capacity to 34GW in the NEM. With the increase in solar panels on rooftops an increase in small-scale battery storage is also assumed, although the majority of solar systems installed are not expected to include storage up to 2030.
The strong growth in rooftop solar is expected to slow the development of some large-scale solar given they will generate and compete in the middle of the day. But large-scale renewable capacity will also grow. Wind generation is expected to see strong deployment including in NSW and Tasmania (with Marinus Link expected to support exports of electricity to the mainland).
Figure 2: Share of renewables by region and market
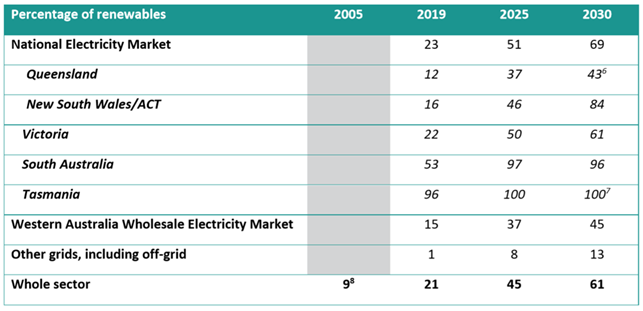
Source: Australia’s Emission Projections 2021
In considering strong growth in rooftop solar, the report assumes curtailment could reduce rooftop solar output by 9800GWh (around 5 per cent of NEM demand) in 2030, given the need to manage system security with increasing amounts of solar coming into the grid at times of low demand.
Other assumptions behind the electricity sector emissions projections include:
- the introduction of firming capacity, such as gas-fired generation in New South Wales (Kurri Kurri and Tallawarra’s expansion, which will provide around 1GW);
- the completion of Snowy 2.0 and an additional 2GW of pumped hydro, which is expected to be incentivised by the New South Wales Electricity Infrastructure Roadmap; and,
- storage (particularly behind the meter storage in homes) which is projected to reach 10 per cent of installed capacity in the NEM by 2030.
Demand
The NEM is not expected to see much growth in electricity demand as energy efficiency will offset the demand from a bigger population. While electricity demand from electric vehicles is expected to result in extra consumption by 2030, it is still only expected to account for 1 per cent of demand and 1-2 per cent of peak demand in the NEM in that period because of increased efficiency and the low base EVs are coming off.
The projections have assumed increased electricity demand for electrolysers producing hydrogen, but by 2030 it is still considered to represent a relatively small amount of total demand in the NEM. Obviously, if there is an increase in deployment of the technology it will lead to higher electricity demand than the report has projected.
Other sectors
Before electricity took over the heavy lifting, land use, land use change and forestry (LULUCF) was the main contributor to Australia’s effort, falling from emitting 89Mt in 2005 to actually consuming 25Mt in 2019. This achievement was largely through the ending of land clearing that was occurring at the start of the century and increases in carbon sequestering in biomass, debris and soils. Whilst it remains a net sink in the period to 2030, it is expected to perform less well due to the impact of La Niña conditions on soil carbon stocks. The emissions sink is projected to reach -16Mt as climatic conditions return to average. (Note farming emissions come under agriculture.)
Agriculture would have reduced its emissions by around 12 per cent between 2005 and 2030, according to the latest projections, and over the next decade will see a slight increase in emissions (1.3 per cent - 75Mt in 2019 to 76Mt in 2030).
Other major contributors to Australia’s emissions such as transport will see emissions increase by 18 per cent in 2030 from the 2005 baseline, according to the projections. But in the decade to 2030, transport emissions are expected to fall 3 per cent (from 100Mt in 2019 to 97Mt in 2030). Emissions from the stationary energy sector will be up around 21 per cent in 2030 compared to the 2005 baseline but are expected to remain constant between 2019 and 2030. By comparison the electricity sector will see a 55 per cent fall in emissions to 2030 from the baseline and between 2019 and 2030 emissions are expected to fall by 50 per cent to 88Mt. The contribution by sector to Australia’s emissions and the projected changes are shown in figures 3 and 4.
Figure 3: Emissions projections, 1990 to 2030, Mt CO₂-e by sector
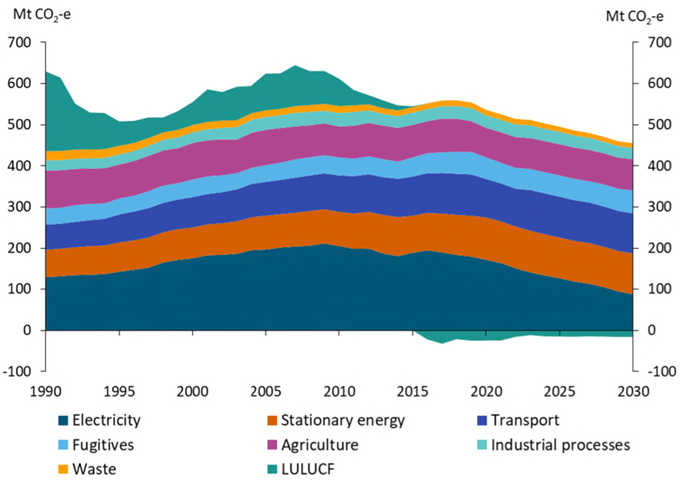
Source: Australia’s Emission Projections 2021
Figure 4: Emissions by sector, Mt CO2-e
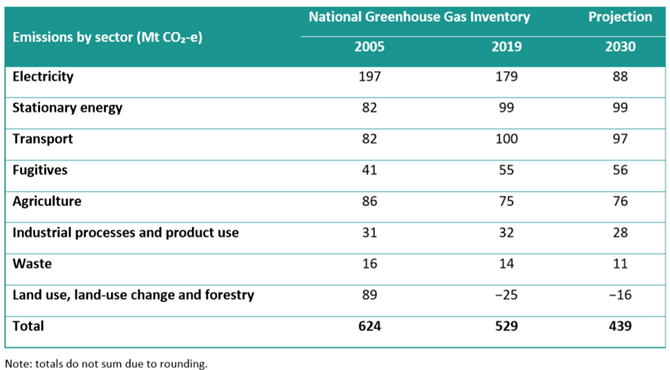
Source: Australia’s Emission Projections 2021
Conclusion
Electricity generators, as major carbon emitters, have long accepted they have a key role in helping Australia reduce its emissions – and the latest emission projections, as well as assessments since 2005, shows the sector has been delivering dramatic results.
Greenhouse gas emissions in the NEM fell by around 20 per cent over the past decade and are now projected to fall 64 per cent by 2030 from the 2005 baseline, as more renewable generation enter the grid and coal plants retire. Emissions in the electricity sector across Australia are expected to drop by 55 per cent in the same period. And they are expected to fall by nearly 31 per cent from 2019 to 2030, while further reductions can be assumed beyond 2030, particularly as new technology is applied, and we see further closure of older fossil-fuel plants.
While electricity continues to make strong progress in emissions reduction, the latest projections are a wakeup call that Australia cannot continue to simply rely predominantly on one sector.
For the country to achieve its net zero by 2050 target it will require other sectors to step up and play their part. While some sectors will need the commercialisation of new technology to make major progress, in other areas economic options and technology already exist, for example for light transport (and given transport is expected to only reduce its emissions by 3Mt on current trajectories to 2030) and electrification of heating.
Related Analysis
Wild Cards: Could these technologies advance the energy transition?
In December 2022, scientists at the National Ignition Facility achieved a landmark nuclear fusion result: a reaction that produced more energy than the laser pulse used to start it. It made headlines globally, but the caveats came quickly. Overall system energy use was still far higher, and commercial viability remains decades away. It was a real breakthrough, but also a reminder of how far the engineering still has to go. That gap between scientific progress and commercial reality is a defining feature of the energy transition today. While solar, wind, and batteries are scaling rapidly and doing most of the heavy lifting, the International Energy Agency estimates that nearly half of the emissions reductions needed for net zero will depend on technologies still at demonstration stage or earlier. This raises the key question: which “wild card” technologies could help close that gap?We take a look.
Nuclear Fusion Deals – Based on reality or a dream?
Last week, Italian energy company ENI announced a $1 billion (USD) purchase of electricity from U.S.-based Commonwealth Fusion Systems (CFS), described as the world’s leading commercial fusion energy company and backed by Bill Gates’ Breakthrough Energy Ventures. CFS plans to start building its Arc facility in 2027–28, targeting electricity supply to the grid in the early 2030s. Earlier this year, Google also signed a commercial agreement with CFS. These are considered the world’s first commercial fusion-power deals. While they offer optimism for fusion as a clean, abundant energy source, they also recall decades of “breakthrough” announcements that have yet to deliver practical, grid-ready power. The key question remains: how close is fusion to being not only proven, but scalable and commercially viable, and which projects worldwide are shaping its future?
Community Power Network Trial: Potential risks and market impact
Australia leads the world in rooftop solar, yet renters, apartment dwellers and low-income households remain excluded from many of the benefits. Ausgrid’s proposed Community Power Network trial seeks to address this gap by installing and operating shared solar and batteries, with returns redistributed to local customers. While the model could broaden access, it also challenges the long-standing separation between monopoly networks and contestable markets, raising questions about precedent, competitive neutrality, cross-subsidies, and the potential for market distortion. We take a look at the trial’s design, its domestic and international precedents, associated risks and considerations, and the broader implications for the energy market.
Send an email with your question or comment, and include your name and a short message and we'll get back to you shortly.