

by Carl Kitchen
Smoke on the solar: The impact on generation
The extreme weather conditions that led to massive bushfires occurring on both Australia’s south east coast last summer and across California more recently has had a dramatic and far reaching impact on people and communities.
The electricity grid was also not immune from the effects of the bushfires. In Australia, the fires forced the temporary disconnection of New South Wales from Victoria. Extreme weather-related events and conditions can and do impact all forms of generation. A heatwave in California led to rolling blackouts earlier this year (See California dreaming of secure supplies, EnergyInsider 27 August 2020)
One area that has come into focus following the bushfires has been the impact of smoke on solar PV output. It has been estimated that the output from rooftop solar PV systems in Sydney and Canberra dropped by 15-45 per cent on heavy smoke haze days as a result of the fires[i].
Meanwhile the Australian Energy Market Operator (AEMO) has collaborated on a study to assess the extent of power loss from large-scale solar farms caused by smoke haze, and recent data from California’s Independent System Operator (CAISO), which covers 90 per cent of utility-scale solar capacity in that state, also shows the impact of bushfire smoke on solar output.
Bushfire smoke carries very small, particulate matter generally 2.5 micrometres (0.0025mm) wide, or smaller, and known as PM2.5[ii] which, like cloud cover, cuts down the amount of sunlight that can reach solar panels. A better understanding of the potential impact on solar generation in areas prone to major bushfires will be important in future planning of the power system, particularly as more solar enters the grid.
Large-scale impact
AEMO collaborated with energy data analysts and modellers, Amperon, to assess the impact of bushfire smoke on the output from 20 large-scale solar farms in New South Wales, Victoria, the ACT and South Australia (shown below).
Solar farms included in study
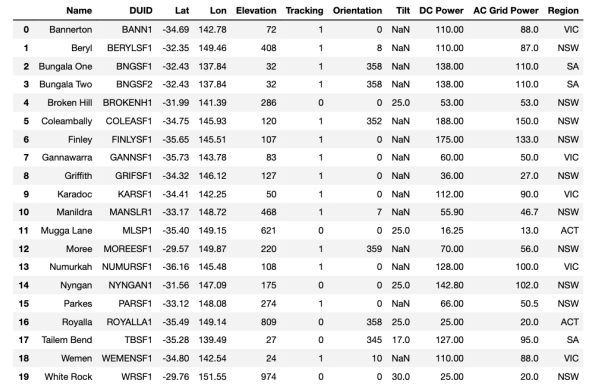
Source: Amperon
The study found that during December last year and January this year there was a mean decrease in output of 4.1 per cent, due to smoke plumes. The biggest recorded impact was in the ACT where the solar farm generation fell 10.3 per cent overall. The two solar farms near Canberra (Royalla Solar Farm and Mugga Lane Solar Park) saw generation fall 8.6 per cent and 12 per cent respectively during last December and January 2020 as a result of aerosols or PM2.5.
Elsewhere generation fell 4.1 per cent for the solar farms assessed in NSW, 3.5 per cent for those in Victoria and 1.2 per cent in South Australia.
Figure 1: Original vs adjusted smoke impacts, averaged over the two smoke sources (NASA, PM2.5)
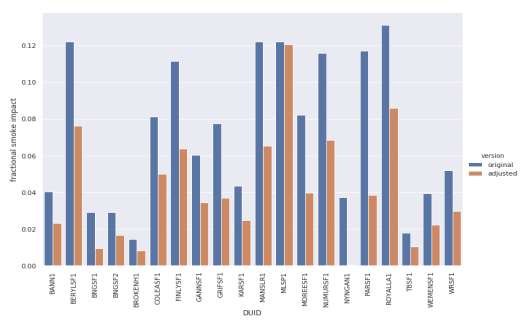
Source: Amperon
The study notes that while bushfires in NSW began in August last year, simulations only showed generation dropping off significantly due to smoke starting in November.
Amongst data sources, the study used SCADA[iii] electricity production data for the solar farms, as well as estimations of the generation for each of the farms, calculated using a software package that simulates the performance of PV systems based on the farms’ specifications and solar irradiance data. In assessing smoke and haze levels it used PM2.5 measures and estimates of solar irradiance with and without aerosols from NASA’s GEOS-5[iv]. The study also considered each solar farms’ layout, inverter types, panel angles and orientation and other factors.
The map below shows the site for each solar farm and the impact of smoke based on the average of both the NASA and PM2.5 data and highlights the impact on solar farms in the ACT, south east NSW and northern Victoria.
Figure 2: Map of final adjusted smoke impacts for all solar farms (averaged over both smoke sources)
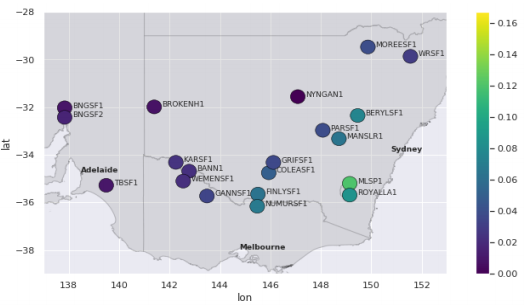
Source: Amperon
Amperon comments that the study “provides a first glance into the effects of smoke from an abundance of bushfires on large-scale solar electricity generation… and hope the results… can serve as a guide for future planning”.
Small-scale impact
A separate assessment of the impact of south east Australia’s bushfires on rooftop solar shows a drop in generation of up to 45 per cent in Canberra. The assessment is based on monitoring of the energy consumption and solar PV performance of 35,000 sites across Australia by software company, Solar Analytics[v].
It estimates that on 1 January PV output in Canberra fell by 45 per cent – this was on a day with heavy smoke haze and a massive Air Quality Index (AQI) reading of more than 3400. Sites in Sydney showed a drop in output of between 15 per cent (10 December) and 27 per cent (21 December) when the city was impacted by bushfire smoke.
According to Solar Analytics’ data, median energy generated at 2200 Sydney sites on clear days during the first two weeks of December last year was 26.6kWh. On 10 December 2019 median generation was 22.7 kWh. The estimated drop in output reported for 21 December was based on a comparison with 17 December 2018, which was a clear day.
A Californian tale
A recent Californian report by the US Energy Information Administration (EIA), also provides some insight into the potential for smoke haze to impact solar output. In California in the first two weeks of September with wildfires burning across the state, the average solar generation from utility-scale solar farms fell substantially based on the CAISO data. The CAISO system covers more than 90 per cent of the large-scale solar farms in the state and generation from those sources fell nearly 30 per cent from the July 2020 average. Those first two weeks of September coincided with peak PM2.5 readings caused by the state’s widespread fires.
The US EIA[vi] reports that PM2.5 levels began increasing in mid-August and reached a record high of 659 µg/m3 on 15 September based on California Air Resources Board data. This was also the highest level since records started in 2000.
The correlation between increases in PM2.5 levels and solar output for the state is shown in figure 3 below.
Figure 3: Daily CAISO solar generation and Californian peak air particulate matter (PM2.5) level, GW
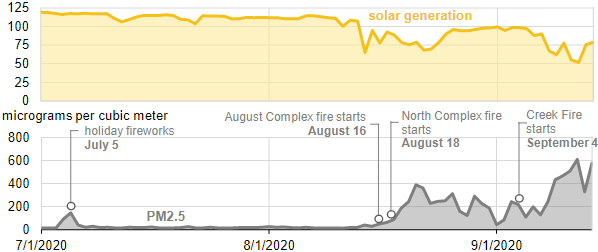
Source: EIA; California Air Resources Board data
For July daily solar output from solar PV and solar thermal plants ranged from 104GWh to 119GWh. The daily output began declining as large wildfires broke out in mid-August and reached a low of 68GWh on 22 August before moving back up to around 100GWh by the end of the month. With an increase in wildfires in September, output fell to as low as 50GWh on 11 September as smoke pollution climbed.
Compared to the first two weeks of September 2019, solar generation in CAISO was down 13.4 per cent for the equivalent two week period this year, despite utility-scale solar capacity increasing by 659MW. As at June 2020 California had a total large-scale solar capacity of 13GW.
Offshore wind patterns were a factor in California’s reduced solar farm output. The winds pushed smoke from the fires, which were concentrated in the state’s north and central regions, south where most of state’s solar capacity is located.
The Californian data does not include generation from small-scale solar PV, which has reached 9.8GW of capacity.
[i] https://www.solaranalytics.com/au/blog/how-much-does-smoke-haze-affect-rooftop-solar-production
[ii] US Energy Information Administration, Smoke from California wildfires decreases solar generation in CAISO, 30 September 2020
[iii] It notes that for nine solar farms availability was variable and unknown or generation was curtailed for extended periods, making the SCADA data “practically unusable as a reference” and for the other 11 sites there was no reliable data source or timeseries stating the available capacity of the solar farms, “which forms an uncertainty in the interpretation of SCADA data”.
[iv] Goddard Earth Observing System.
[v] https://www.solaranalytics.com/au/blog/how-much-does-smoke-haze-affect-rooftop-solar-production
[vi] US EIA, Smoke from California wildfires decreases solar generation in CAISO, 30 September 2020
Related Analysis
Wild Cards: Could these technologies advance the energy transition?
In December 2022, scientists at the National Ignition Facility achieved a landmark nuclear fusion result: a reaction that produced more energy than the laser pulse used to start it. It made headlines globally, but the caveats came quickly. Overall system energy use was still far higher, and commercial viability remains decades away. It was a real breakthrough, but also a reminder of how far the engineering still has to go. That gap between scientific progress and commercial reality is a defining feature of the energy transition today. While solar, wind, and batteries are scaling rapidly and doing most of the heavy lifting, the International Energy Agency estimates that nearly half of the emissions reductions needed for net zero will depend on technologies still at demonstration stage or earlier. This raises the key question: which “wild card” technologies could help close that gap?We take a look.
Australia’s Home Battery Surge: A Question of Equity
Australia is a global leader in rooftop solar, with more than 4.3 million households and small businesses installing photovoltaic (PV) systems as of February 2026. Battery uptake has also accelerated, particularly since the introduction of the Cheaper Home Batteries Program in July 2025, which offers around a 30 per cent upfront discount for systems between 5 kWh and 100 kWh. More than 236,000 batteries had been installed by February 2026, although this likely understates the true figure due to reporting lags; the Federal Government has since indicated installations have surpassed 250,000 as of March 2026. Despite this rapid growth, an important question remains: who is actually benefiting from these subsidies?
Getting it right: How to make the “Solar Sharer” work for everyone
On paper, the government’s proposed "Solar Sharer Offer" (SSO) sounds like the kind of policy win that everyone should cheer for. The pitch is delightful: Australia has too much solar power in the middle of the day; the grid is literally overflowing with sunshine: let’s give households free energy during 11am and 2pm. But as the economist Milton Friedman famously warned, "There is no such thing as a free lunch." Here is a no-nonsense guide to making the SSO work.
Send an email with your question or comment, and include your name and a short message and we'll get back to you shortly.