
by Australian Energy Council
Report provides insights into energy transition
The transition of the energy grid continues apace and its impact on how the system operates continue to emerge. The latest GenInsights21 report produced by Global-Roam and Greenview Strategic Consulting provides analysis of extensive generation data to provide an assessment of what has happened over the past 5-23 years and establish trends and insights into the changing grid.
Below we take a closer look at its assessment of rooftop solar in particular.
The speed of changes occurring in the grid are illustrated by the shift in official forecasts between 2012 and 2020. The expected changes in the electricity mix over two decades to 2030 made in 2012 (after the RET target had been expanded) is shown in figure 1.
Figure 1: Projections of fuel share in electricity supply - 2012
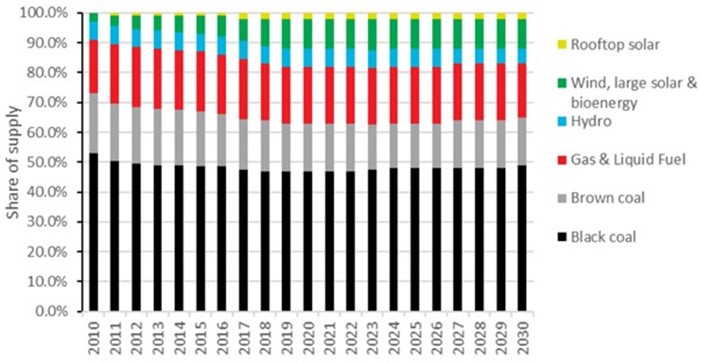
Source: Australian Government Emission Projections 2012
In these forecasts rooftop solar was expected to grow from almost nothing in 2010 to around 2 per cent in 2017 while large-scale solar was combined with wind and bioenergy. Together they were expected to increase from a 3 per cent share in 2010 to peak at 10 per cent by 2019 and then not grow beyond that.
Jump forward and in 2020 rooftop solar’s share was actually at 6 per cent and projected to hit 17 per cent by 2030 while large-scale solar was estimated to have 2 per cent share in 2020 with projections it would increase to 8 per cent by 2026. The shift in projections is shown in figure 2 below.
Figure 2: Projections of fuel share in electricity supply – 2020
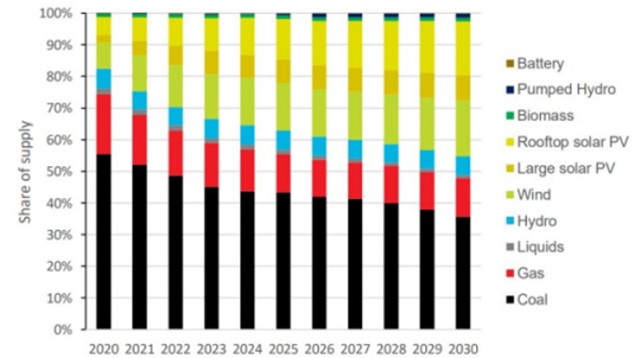
Source: Australian Government Emission Projections 2020
In both 2020 and 2021 around 3.2GW of rooftop capacity was added with the total capacity of rooftop solar now reaching around 17GW. The growth of rooftop solar has continued as our latest Solar Report illustrates and the accelerating growth in installations is also shown in figure 7 below, helped largely by the falling cost of solar. While the most recent pace may slacken over time – and in fact the first quarter this year shows a drop in installations compared to the same period in previous years [See our latest Solar Report] - we are expected to still see “annual additions at the gigawatt scale for several years to come”.
So the changes have been dramatic and as we have previously reported the scale of rooftop PV is having a profound effect on how the system is managed, on minimum demand levels (with record levels continually being reported) and changes to allow the remote curtailment of output at critical times in South Australia and WA. Small-scale solar PV is challenging the status quo positively and negatively.
At its current scale rooftop solar far exceeds the biggest power station in the National Electricity Market (NEM) the 2922MW Eraring plant in New South Wales. When looking at the maximum daily NEM generation from rooftop panels since 2016 it has been steadily rising and has reached an estimated 8500MW, according to GenInsights21, as shown below.
Figure 3: Daily NEM Rooftop PV Generation (MW)
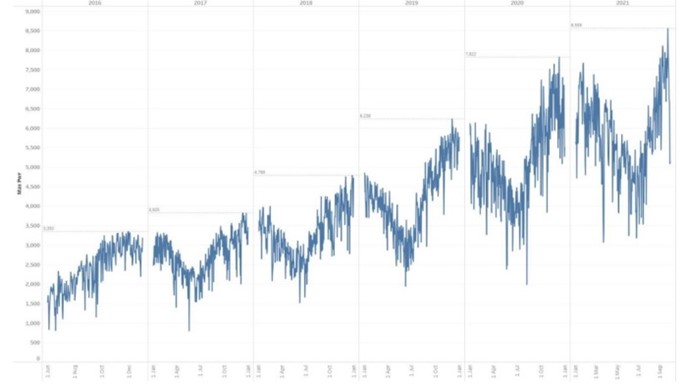
Source: GenInsights21
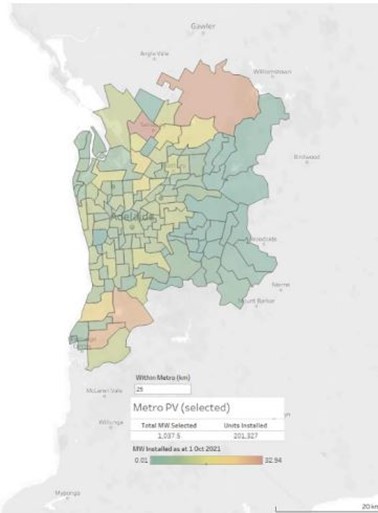
In terms of geographic spread more than third of a region’s installed capacity is on rooftops in most metropolitan areas with the concentration of panels in Adelaide’s metro area well above the average at 60 per cent with more than 1000MW now installed on the city’s homes out of a total of 1740MW statewide (see map below).
That level of concentration can create challenges for the grid particularly when weather conditions quickly shift. On 27 October last year Adelaide “woke to spectacular cloud formations” (see image below) followed by rain and lightning strikes. The stormfront was estimated to be 100km wide and moving at 50KMh across Adelaide (see radar image below), leading to a large decrease in rooftop solar output and a rapid increase in operational demand from the grid. A dramatic example, but one that serves to highlight the impact that concentrated and high levels of rooftop solar can have on energy supply.
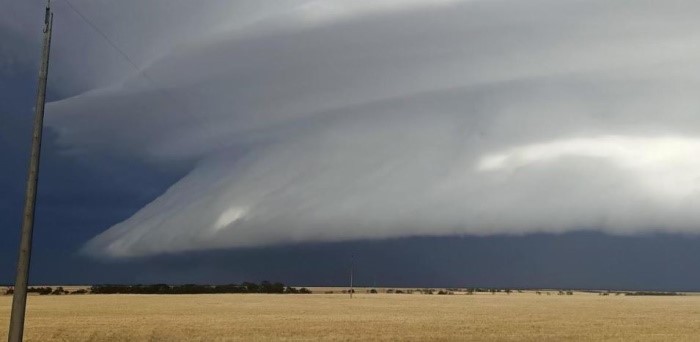
South Australia’s “spectacular cloud formations”
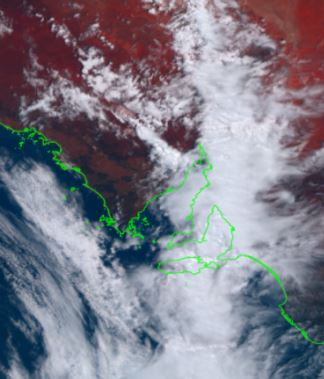
Radar Image of storm front over Adelaide and SA.
And the Australian Energy Market Operator’s latest Quarterly Energy Dynamics report (Q1 2022) also highlights the impact solar PV continues to have on demand. The review shows that South Australia set a new minimum first quarter demand record of 209MW over the half hour ending 1330hrs on Saturday, 19 February. That was 149MW lower than the previous Q1 minimum set in 2021. Key drivers were mild, sunny conditions and low weekend demand and as a result 1,270 MW of distributed PV output accounted for 86 per cent of the underlying demand.
On the same day, Victoria also recorded a new record low of 2,792 MW (the half hour ending 1300 hrs), 124MW lower than the previous record set in the previous corresponding quarter, although it was 459MW higher than the all-time record set in Q4 2021. Distributed PV delivered 2,308MW and met 45 per cent of underlying demand.
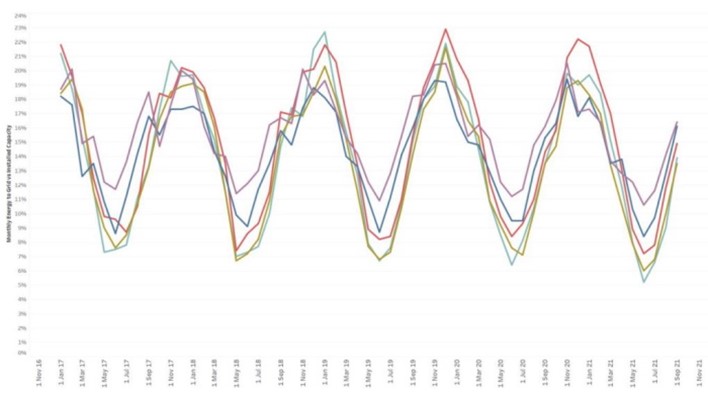
The changes in minimum demand by time of day that is being driven by rooftop solar since 2006 is shown graphically below.
Figure 4: SA Total Demand
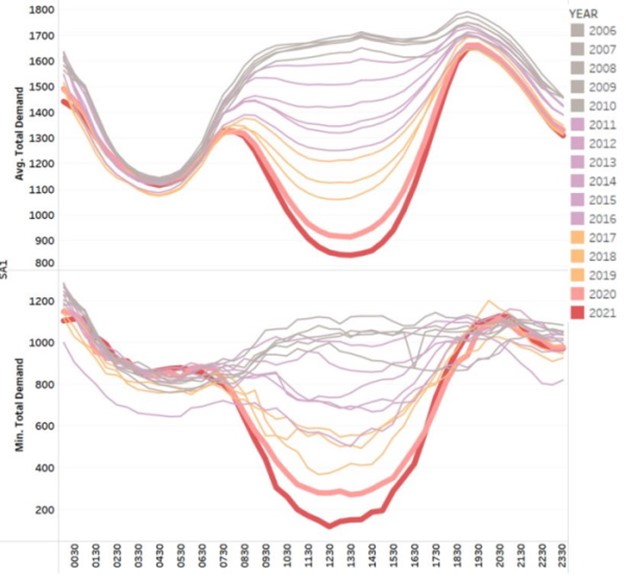
Source: GenInsights21
There have been significant efforts put in place to try and get greater visibility of behind-the-meter solar installations given the scale of rooftop solar is not only changing minimum demand levels and when these occur but also increasing the challenges of accurate forecasting of supply as well as expected operational demand.
In terms of utilisation 76 per cent of the solar output makes it to the market in the peak solar months around October and November with a maximum of around 50 per cent generating during the less conducive winter period.
Figure 5: Max Capacity vs Installed Capacity – Rooftop Max Utilisation by region
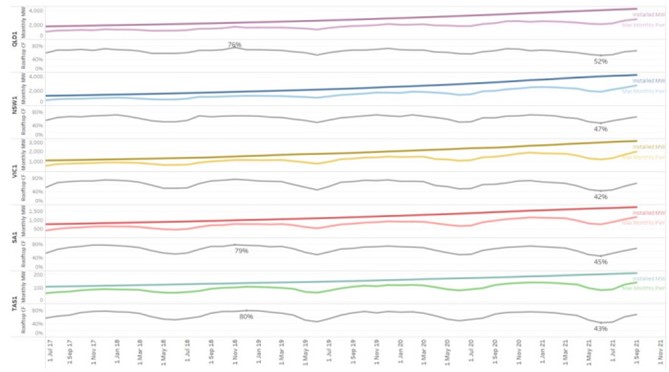
Source: GenInsights21
The average capacity factor for rooftop solar is around 12 per cent, much lower than utility-scale solar, which averages 22.5 per cent (capacity factors in the warmer months can be over 30 per cent in some regions), yet it is increasingly being curtailed and ironically this can occur due to the significant levels of generation from rooftop panels.
The average capacity exported to the grid is shown in figure 6.
Figure 6: Rooftop PV – Ave capacity exported by region
Source: GenInsights21
GenInsights21 has found that maximum possible generation for each month appears to be falling with average minimum generation also showing slight decreases which could flag challenges such as:
- Shading and cleaning maintenance requirements.
- Potentially some increased combining of solar with battery storage systems.
- The age of installations – given inverter and panel efficiency will decline over time.
In terms of the age of installations, however, the GenInsights21 analysis shows that less than 3 per cent of systems are more than 10 years old. Figure 7 below shows the age of plant by region and the percentage installed (accumulated) by year, so, for example, NSW has installed more than half its rooftop capacity in the past three years and 18 per cent in the past year, while South Australia, Queensland and Victoria have installed more than 40 per cent of their rooftop solar over the past three years.
Figure 7: Rooftop solar systems by age (in years) and MW installed
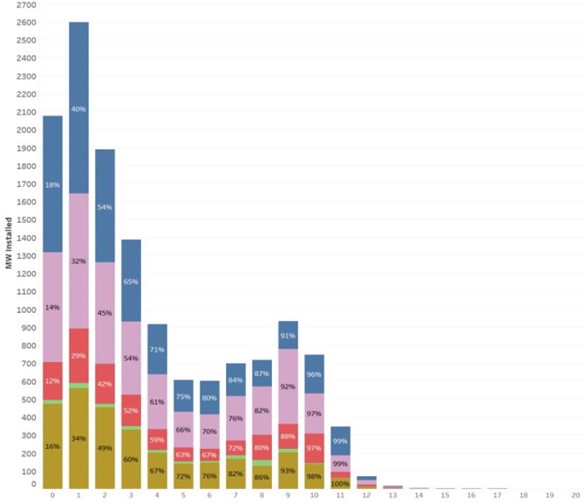
Source: GenInsights21
Related Analysis
Wild Cards: Could these technologies advance the energy transition?
In December 2022, scientists at the National Ignition Facility achieved a landmark nuclear fusion result: a reaction that produced more energy than the laser pulse used to start it. It made headlines globally, but the caveats came quickly. Overall system energy use was still far higher, and commercial viability remains decades away. It was a real breakthrough, but also a reminder of how far the engineering still has to go. That gap between scientific progress and commercial reality is a defining feature of the energy transition today. While solar, wind, and batteries are scaling rapidly and doing most of the heavy lifting, the International Energy Agency estimates that nearly half of the emissions reductions needed for net zero will depend on technologies still at demonstration stage or earlier. This raises the key question: which “wild card” technologies could help close that gap?We take a look.
Australia’s Home Battery Surge: A Question of Equity
Australia is a global leader in rooftop solar, with more than 4.3 million households and small businesses installing photovoltaic (PV) systems as of February 2026. Battery uptake has also accelerated, particularly since the introduction of the Cheaper Home Batteries Program in July 2025, which offers around a 30 per cent upfront discount for systems between 5 kWh and 100 kWh. More than 236,000 batteries had been installed by February 2026, although this likely understates the true figure due to reporting lags; the Federal Government has since indicated installations have surpassed 250,000 as of March 2026. Despite this rapid growth, an important question remains: who is actually benefiting from these subsidies?
Getting it right: How to make the “Solar Sharer” work for everyone
On paper, the government’s proposed "Solar Sharer Offer" (SSO) sounds like the kind of policy win that everyone should cheer for. The pitch is delightful: Australia has too much solar power in the middle of the day; the grid is literally overflowing with sunshine: let’s give households free energy during 11am and 2pm. But as the economist Milton Friedman famously warned, "There is no such thing as a free lunch." Here is a no-nonsense guide to making the SSO work.
Send an email with your question or comment, and include your name and a short message and we'll get back to you shortly.