

by Carl Kitchen
Reaching new heights: NEM system costs
Last week the Australian Energy Market Operator (AEMO) released its latest Quarterly Energy Dynamics Report with the majority of coverage focused on the fact that average National Electricity Market (NEM) spot prices fell to their lowest level since the fourth quarter of 2016.
Less noticed was that total NEM system costs hit new records. These are the costs incurred to keep the system stable and were made up of Frequency Control Ancillary Services (FCAS), compensation for directing generators to continue to operate, as well as the Reliability and Emergency Reserve Trader (RERT) a function and the cost of directing renewable generators to curtail their output.
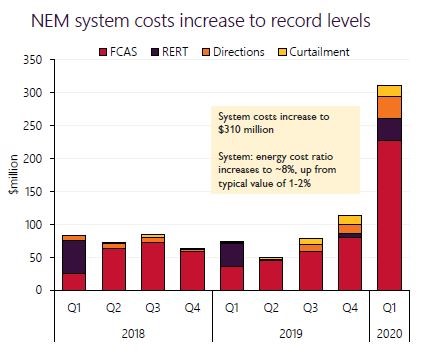
Overall system costs increased to $310 million, or 8 per cent of the energy costs for the quarter (they are typically around 1-2 per cent each quarter[i]). Market participants cover the cost, although ultimately they are borne by consumers of the higher system costs incurred in Q1, $166 million was recovered from generators, while $144 million was recovered from electricity retailers.
Figure 1: NEM System Costs Q1 2020
Source: AEMO
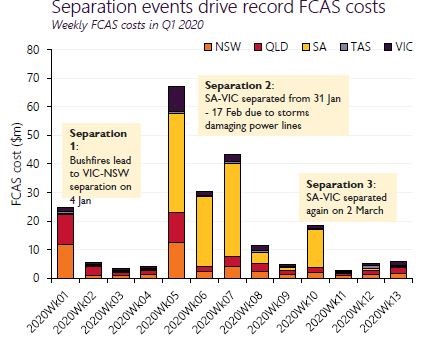
The main factor behind the record NEM system costs was three power system events with the most significant being the 18-day separation of Victoria and South Australia following a storm that knocked out transmission lines on 31 January. That separation accounted for 74 per cent ($229 million) of the system costs. There was a further separation of SA and the Mortlake Power Station in western Victoria from the rest of the NEM for eight hours on 2 March this year. The other major separation occurred when multiple transmission lines in southern New South Wales tripped during the bushfires, which led to the NEM being split into two islands to the north and south for nearly seven hours on 4 January.
FCAS was the dominant contributor to the increased costs rising to a quarterly record of $227 million with SA in particular experiencing high FCAS costs to maintain the security of its grid.
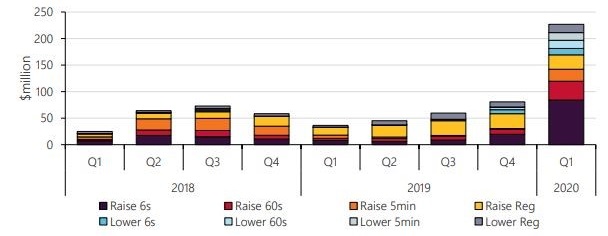
Nearly 75 per cent of the costs were recovered from generators ($166 million), while the remaining $61 million was recovered from retailers. The largest element of the increased costs came from the Contingency Raise FCAS markets[ii] - up from $30 million in Q4 2019 to $142 million in Q1 this year (see figure 2). The impact of the separation events on FCAS costs is shown in figure 3.
Figure 2: Quarterly FCAS Costs by Market
Source: AEMO
Figure 3: Impact of Separation Events on FCAS Costs
Source: AEMO
FCAS
In the NEM there are eight markets or types of FCAS (which are outlined in AEMO’s Guide to Ancillary Services) which are designed to manage power system security and the quality of the electricity supplied by the grid. Two are regulation and designed to deal with minor dips or increases in frequency, while the other six are for contingency events and deal with more substantial drops or rises and are designed to stabilise or recover frequency (which needs to be maintained at around 50Hz).
FCAS lets AEMO manage changes in generation or load. In the past it has barely been of note largely because the capabilities were delivered by traditional power stations as a by-product of generating electricity and there were many plants capable of offering the services. That has changed as the energy mix has changed. More recently batteries have entered the market to offer these services.
Under unusual conditions FCAS prices can jump significantly to the market price cap of $14,700/MWh.
The three separation events reported in AEMO’s Quarterly Energy Dynamics report represent are the most recent example of unusual conditions. They accounted for 77 per cent or $175 million of total FCAS costs in the first quarter.
Another factor in the higher FCAS costs, particularly in SA following the islanding events, is that they were driven by the need to deliver increased FCAS locally rather than being able to draw on other parts of the NEM. Under normal operating conditions FCAS can potentially be supplied from anywhere in the NEM, so the cheapest offers from generators, batteries, or loads in any region can be called on[iii].
In the case of South Australia’s 18-day separation from the rest of the NEM the increased local demand for FCAS was largely met by increased supply from state’s gas-fired generation. SA also saw the average amount of Lower 5 minute FCAS[iv] enabled in the region increase by 98 per cent and the average amount of Raise 6 Second FCAS enabled increased by 10 per cent.
There was also an extended price spike of the Raise 6 Second FCAS Market in the state from 31 January-1 February when it hit the $14,700/MWh price cap for 365 minutes and led to the Cumulative Price Threshold being exceeded and an Administered Price Period introduced for FCAS in the region.
SA, along with Mortlake Power Station and Victoria’s Portland Aluminium Smelter, were separated from the NEM and FCAS was acquired locally from limited local supply, and AEMO reports there were periods of insufficient Raise 6 Second supply in the region to meet its requirements.
Directions
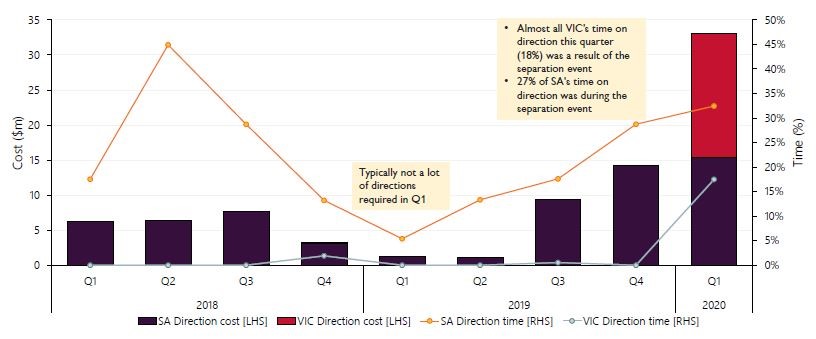
Additional system costs during Q1 came from AEMO issuing directions to gas-fired generators in South Australia and Victoria (83MW and 66MW was directed respectively) to maintain system security, including during the 31 January separation. Total directions costs reached $33 million, more than double the record set in Q4 last year, the QED shows.
Figure 4: System Direction Costs
Source: AEMO
The significant increase in direction costs and frequency was again largely driven by the separation event between SA and Victoria – the 18 day separation (31 Jan-17 Feb) led to $21.5 million of direction costs with costs in Victoria accounting for $17.7 million. Multiple gas-fired units in SA and Mortlake Power Station in Victoria were directed to remain in the market to maintain system security while output was curtailed at several SA and Victorian wind farms. An average of 435MW of gas-fired generation and 87MW in SA were directed during this event, while 432MW of variable renewable generation was curtailed.
AEMO notes that another factor in the directions in SA was reduced daytime operational demand and spot prices, which made it uneconomic for gas-fired generators, so units were subsequently directed to stay online.
Curtailment
The curtailment of renewable generation increased to 7 per cent of total renewable energy output, which is a record (see figure 4). Again the main factor was SA’s separation from the NEM and during this 18-day period six wind farms had their output curtailed to zero to manage system security. This separation accounted for an estimated average quarterly curtailment of 75MW.
Figure 5: SA Separation Leads to Record NEM VRE Curtailment
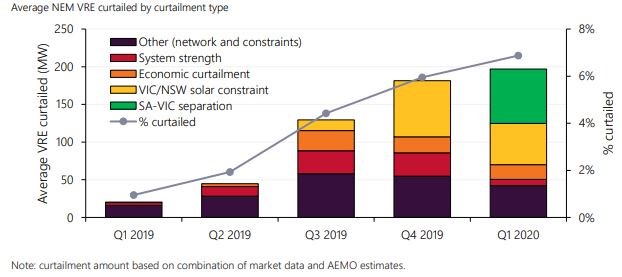
Source: AEMO
At the same time, during the SA separation events, the high FCAS price spikes led SA wind farms to adjust their approach to mitigate their FCAS liabilities.
On 12 February when the SA Raise 60 Second FCAS price jumped to $14,500/MWh for two hours, 11 of 14 online SA wind farms curtailed their own output due to the high FCAS liabilities which saw a sudden drop in wind output that was also not forecast (see figure 5):
Figure 6: SA wind farms reduce output due to avoid high FCAS exposure
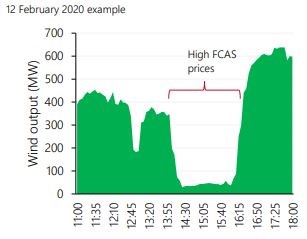
Source: AEMO
Aside from SA, the system security constraints on five solar farms in the West Murray Zone (four in Victoria and one in NSW) introduced in 2019 remained in place during the first quarter, but was lower than the last quarter last year.
There were additional constraints in Queensland with new system strength limits announced for North Queensland, which constrain the output of the Mount Emerald wind farm, as well as the Haughton and Sun Metals solar farms to maintain system security, depending on the synchronous units online at the time. Between 19 and 31 March these constraints limited output for a quarter of the time and reduced the output from the Haughton solar farm by 18 per cent and from the Mount Emerald wind farm by 7 per cent.
Conclusion
Increasing demands on ancillary services with greater demands placed on generators and loads which provide the services due to the increased penetration of renewable energy and withdrawal of dispatchable plants have been previously forecast (see The Rise of Ancillary Services). The continued shift towards more variable generation and consumption, and increasing challenges in predicting the variability that can occur, increases the potential for frequency disturbances.
While the most recent records were driven by unusual events, and particularly South Australia’s extended separation from the NEM, they do underline the need to carefully manage the energy transition and reinforce the increased importance of system services.
[i] Quarterly Energy Dynamics, Q1 2020, AEMO April 2020
[ii] Contingency Raise FCAS Markets:
- Fast Raise (6 Second Raise) – 6 sec response to arrest a major drop in frequency following a contingency event.
- Slow Raise (60 Second Raise) – 60 sec response to stabilise frequency following a contingency event.
- Delayed Raised (5 minutes Raise) – 5 minute response to recover frequency to the normal operating band following a major drop in frequency.
[iii] http://www.wattclarity.com.au/articles/2020/02/dont-forget-about-fcas/
[iv] Contingency Lower FCAS Markets:
- Fast Lower (6 Second Lower) – 6 sec response to arrest major rise in frequency following a contingency event.
- Slow Lower (60 Second Lower) – 60 sec response to stabilise frequency following a major rise in frequency.
- Delayed Lower (5 Minute Lower) – 5 min response to recover frequency to the normal operating band following a major rise in frequency.
Related Analysis
Wild Cards: Could these technologies advance the energy transition?
In December 2022, scientists at the National Ignition Facility achieved a landmark nuclear fusion result: a reaction that produced more energy than the laser pulse used to start it. It made headlines globally, but the caveats came quickly. Overall system energy use was still far higher, and commercial viability remains decades away. It was a real breakthrough, but also a reminder of how far the engineering still has to go. That gap between scientific progress and commercial reality is a defining feature of the energy transition today. While solar, wind, and batteries are scaling rapidly and doing most of the heavy lifting, the International Energy Agency estimates that nearly half of the emissions reductions needed for net zero will depend on technologies still at demonstration stage or earlier. This raises the key question: which “wild card” technologies could help close that gap?We take a look.
Nuclear Fusion Deals – Based on reality or a dream?
Last week, Italian energy company ENI announced a $1 billion (USD) purchase of electricity from U.S.-based Commonwealth Fusion Systems (CFS), described as the world’s leading commercial fusion energy company and backed by Bill Gates’ Breakthrough Energy Ventures. CFS plans to start building its Arc facility in 2027–28, targeting electricity supply to the grid in the early 2030s. Earlier this year, Google also signed a commercial agreement with CFS. These are considered the world’s first commercial fusion-power deals. While they offer optimism for fusion as a clean, abundant energy source, they also recall decades of “breakthrough” announcements that have yet to deliver practical, grid-ready power. The key question remains: how close is fusion to being not only proven, but scalable and commercially viable, and which projects worldwide are shaping its future?
Community Power Network Trial: Potential risks and market impact
Australia leads the world in rooftop solar, yet renters, apartment dwellers and low-income households remain excluded from many of the benefits. Ausgrid’s proposed Community Power Network trial seeks to address this gap by installing and operating shared solar and batteries, with returns redistributed to local customers. While the model could broaden access, it also challenges the long-standing separation between monopoly networks and contestable markets, raising questions about precedent, competitive neutrality, cross-subsidies, and the potential for market distortion. We take a look at the trial’s design, its domestic and international precedents, associated risks and considerations, and the broader implications for the energy market.
Send an email with your question or comment, and include your name and a short message and we'll get back to you shortly.