
by AEC
Getting the mail on solar installations
The Australian Energy Council has reviewed the latest Clean Energy Regulator (CER) data to highlight the top suburbs and areas for solar installations by state and territory.
The 20 years of data collected by the CER[i], shows Bundaberg (4670) to be the leading postcode for solar installations, while another three Queensland suburbs are in the top 10 postcodes for the total number of rooftop solar installations. Western Australia also has four postcodes in the top 10 and Victoria has two, see table 1 below.
Table 1: Top 10 Postcodes for solar installations (2001-End of Q1 2021)
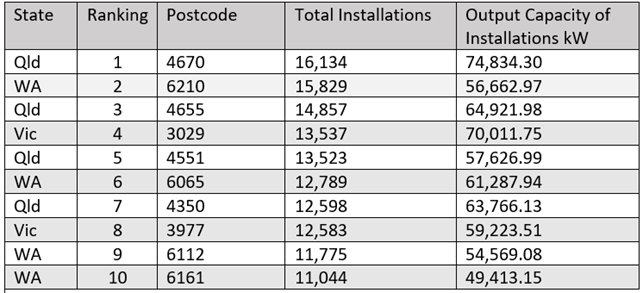
Source: Clean Energy Regulator
But when we look at the first quarter installations this year, there has been a shift in the post codes: of the top 10, two were in Queensland, while New South Wales and Victoria each have three of the leading post codes, and Western Australia has two.
Queensland still recorded the leading post code in the first quarter this year - 4300, which includes suburbs in the City of Ipswich (Springfield, Bellbird Park, Augustine Heights, Camira, Brookwater) - where a total of 650 solar systems were installed in the first three months of 2021. It was followed by the Wagga Wagga area in NSW (post code 2650), which reported 549 solar PV systems installed, and post code 3029 (Hoppers Crossing, Tarneit and Truganina) in Melbourne’s west. The top post codes for each state and territory are included in in the map below which also shows the total number of PV systems installed in each jurisdiction during the first quarter this year.
Figure 1: Quarterly small-scale solar PV installations by state and territory, Q1 2021
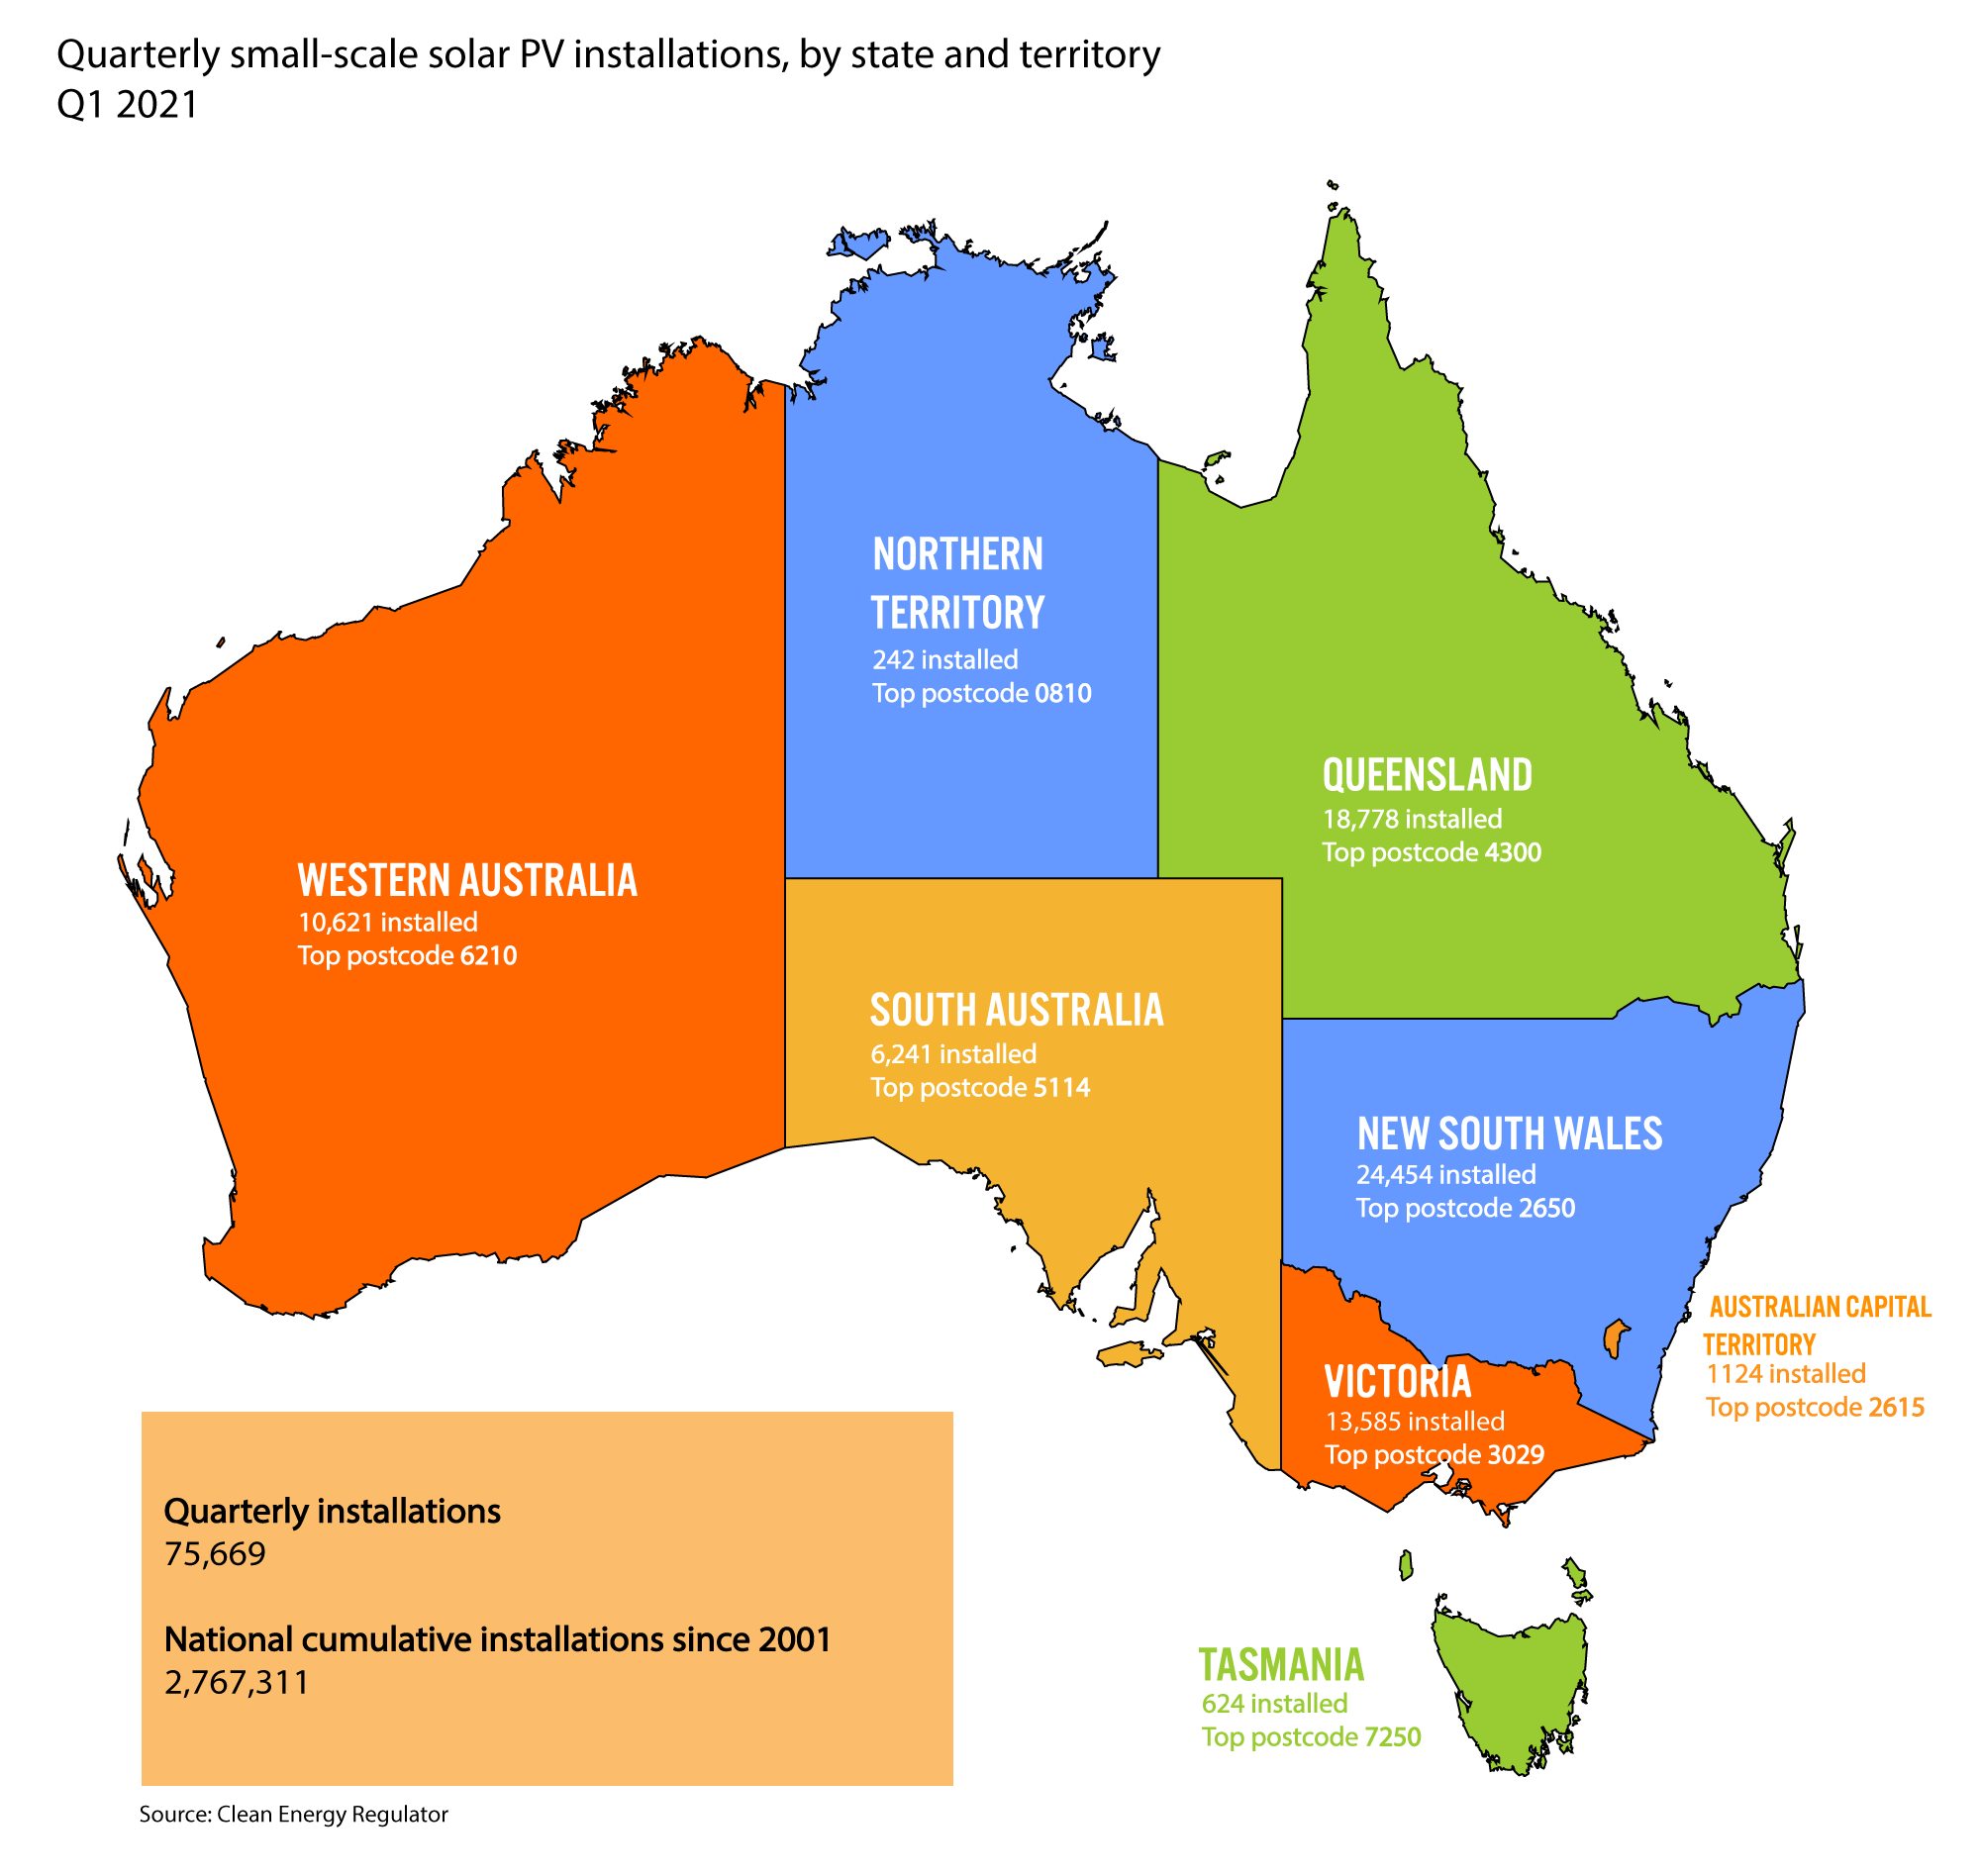

The top three post codes for each jurisdiction in the first quarter 2021 are shown in the following tables.
Table 2: Top post codes Q1 2021, New South Wales
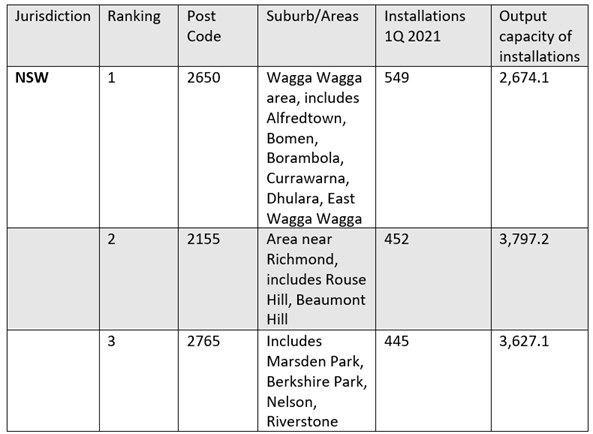
Table 3: Top post codes Q1 2021, Queensland
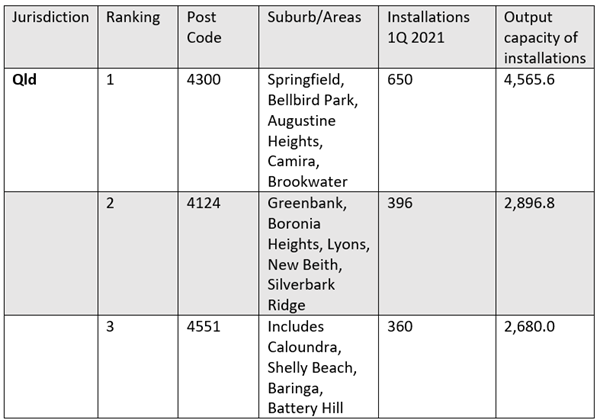
Table 4: Top post codes Q1 2021, Victoria
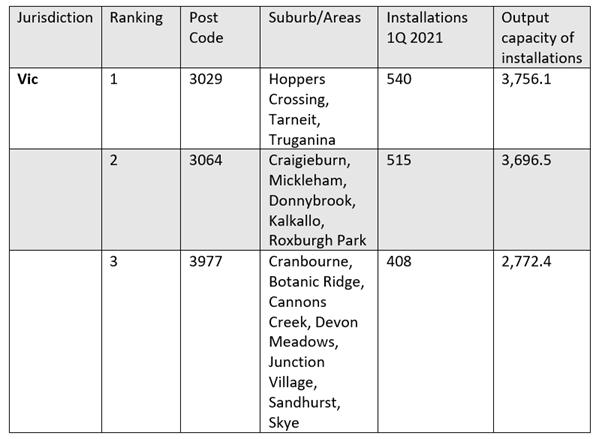
Table 5: Top three post codes, South Australia
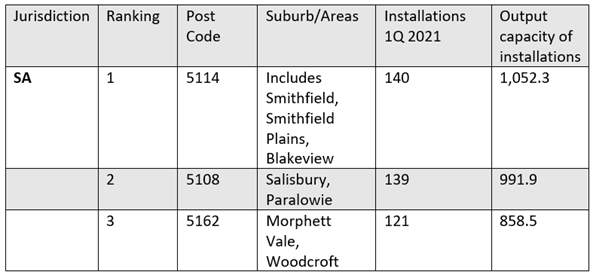
Table 6: Top post codes Q1 2021, ACT
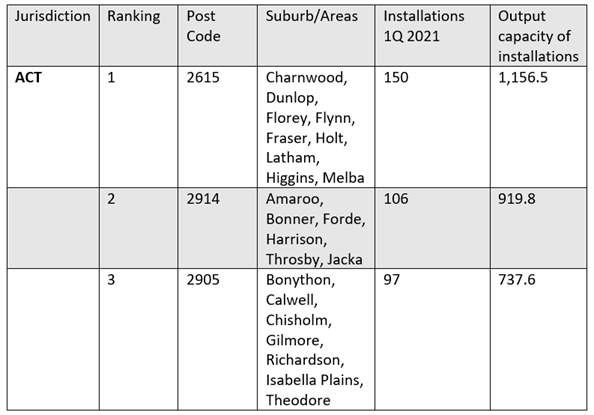
Table 7: Top post codes Q1 2021, Tasmania
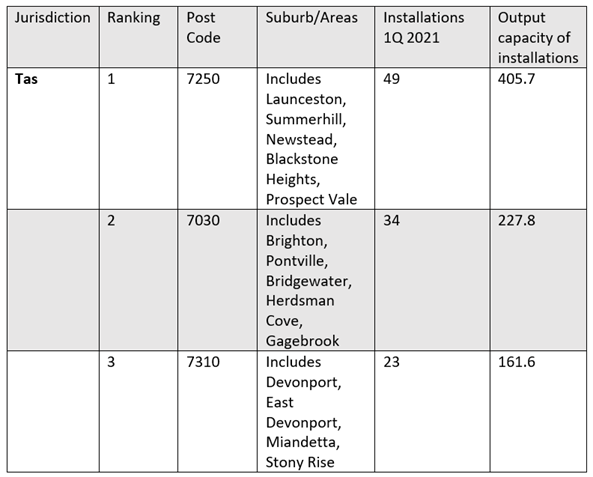
Table 8: Top post codes Q1 2021, Western Australia
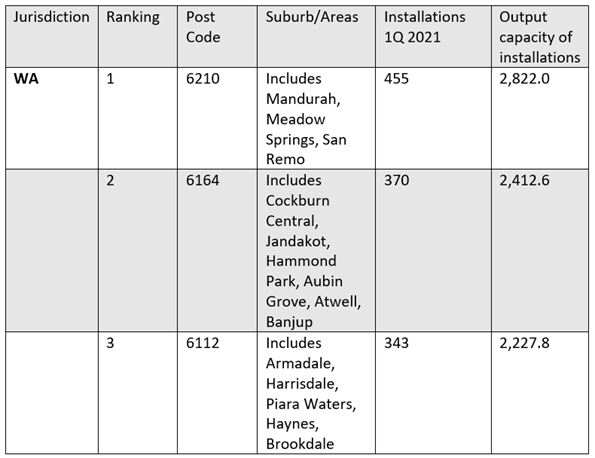
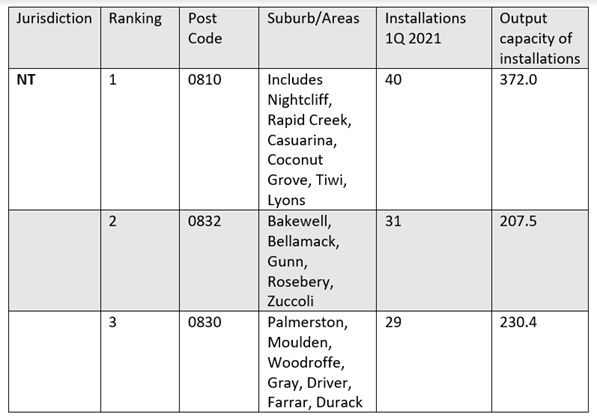
Table 9: Top post codes Q1 2021, Northern Territory
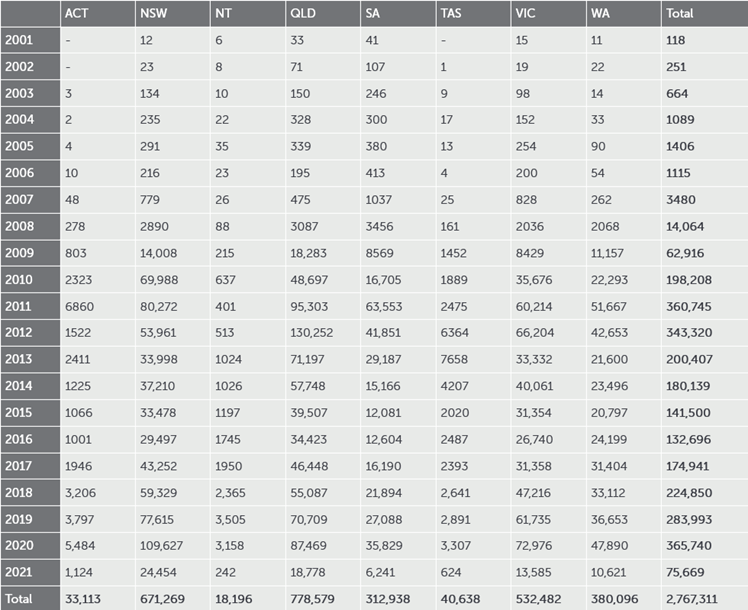
By state, New South Wales has led the annual level of solar installations, followed by Queensland. Queensland previously set the pace for solar system installations prior to 2018.
Last year New South Wales installations reached 109,627, while Queensland rooftops were home to 87,469 new PV systems.
A total of 365,740 systems were installed in 2020, while this year 75,669 systems had been installed in the first quarter (the number of installations by state for 2020 and in the first quarter are shown in table 10). This took the national total to 2.76 million systems with a rated total output of 13,861 MW since 2001
Table 10: Total installations by state and territory, 2001- Q1 2021
Source: Clean Energy Regulator
[i] 2001-End of March 2021
Related Analysis
Wild Cards: Could these technologies advance the energy transition?
In December 2022, scientists at the National Ignition Facility achieved a landmark nuclear fusion result: a reaction that produced more energy than the laser pulse used to start it. It made headlines globally, but the caveats came quickly. Overall system energy use was still far higher, and commercial viability remains decades away. It was a real breakthrough, but also a reminder of how far the engineering still has to go. That gap between scientific progress and commercial reality is a defining feature of the energy transition today. While solar, wind, and batteries are scaling rapidly and doing most of the heavy lifting, the International Energy Agency estimates that nearly half of the emissions reductions needed for net zero will depend on technologies still at demonstration stage or earlier. This raises the key question: which “wild card” technologies could help close that gap?We take a look.
Australia’s Home Battery Surge: A Question of Equity
Australia is a global leader in rooftop solar, with more than 4.3 million households and small businesses installing photovoltaic (PV) systems as of February 2026. Battery uptake has also accelerated, particularly since the introduction of the Cheaper Home Batteries Program in July 2025, which offers around a 30 per cent upfront discount for systems between 5 kWh and 100 kWh. More than 236,000 batteries had been installed by February 2026, although this likely understates the true figure due to reporting lags; the Federal Government has since indicated installations have surpassed 250,000 as of March 2026. Despite this rapid growth, an important question remains: who is actually benefiting from these subsidies?
Getting it right: How to make the “Solar Sharer” work for everyone
On paper, the government’s proposed "Solar Sharer Offer" (SSO) sounds like the kind of policy win that everyone should cheer for. The pitch is delightful: Australia has too much solar power in the middle of the day; the grid is literally overflowing with sunshine: let’s give households free energy during 11am and 2pm. But as the economist Milton Friedman famously warned, "There is no such thing as a free lunch." Here is a no-nonsense guide to making the SSO work.
Send an email with your question or comment, and include your name and a short message and we'll get back to you shortly.