

by Carl Kitchen
Gas supply and gas generation put on centre stage
Gas supply and gas generation has again taken centre stage with the release of the most recent Australian Energy Statistics, among other reports.
The Australian Energy Statistics[i] released last week, showed that gas-fired power generation (GPG) grew by 6 per cent in the past year to 21 per cent of total generation, while coal-fired power stations contributed 56 per cent of electricity generation in 2019.
The new data also shows 21 per cent of Australia’s electricity came from renewable energy last year, up from 19 per cent in 2018. The major sources of renewable generation were wind (7 per cent of total generation) and solar (7 per cent) followed by hydro (5 per cent). There was 6.3GW of new renewable energy capacity delivered in 2019 with a similar level expected to be delivered this year, with solar leading the way (up 46 per cent in 2019).
Figure 1: Summary of electricity generation 2019
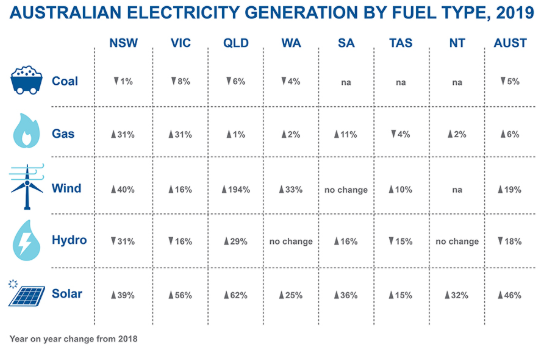
Source: Australian Energy Statistics
For the Federal Government the statistics highlighted the ongoing importance of gas and coal in the grid and pointed to the particular importance of gas in supporting the growth or renewables.
Previously the Government’s Technology Investment Roadmap discussion paper noted that the role of gas to support solar and wind generation with firming gas plants, able generators to ramp up or down. It pointed to the critical role gas played in balancing supply in South Australia and the emissions benefits, noting that while its share of generation has increased, the emissions intensity of the local grid has fallen (see figure 2). And according to the International Energy Agency (IEA), switching from coal to gas can provide ‘quick wins’ for global emissions reductions and has the potential to reduce electricity sector emissions by 10 per cent[ii].
The Chief Scientist, Alan Finkel, believes that Australia is going to need to rely on gas generation to support renewables for the next 10 to 20 years and potentially for up to 30 years[iii].
Figure 2: SA’s falling emissions with increased gas generation
Source: Technology Investment Roadmap: discussion paper
While gas-generation has played a relatively small part in the National Electricity Market’s (NEM) generation mix, its ability to deliver quick, reliable supply when needed has given it a crucial role[iv]. Along with hydro and storage, gas generation will continue to play a part in managing the variability of wind and solar.
Weather patterns
With increasing amounts of renewable generation in the NEM, annual demand for gas-fired power generation (GPG) and with it gas supply, can be expected to become increasingly subject to variations in weather conditions year-on-year.
While more gas generation is likely to be introduced to the NEM it is likely to be predominantly in the form of peaking plants - open cycle gas turbines (OCGT) and reciprocating engines (a more advanced version of this technology was used in the Barker Inlet Power Station built in South Australia, which was covered in depth in Barker Inlet: A new technology responding to the market).
Currently there is more than 13,000MW of gas-fired generating capacity in Australia with more than 9,000MW in the NEM[v] (see list at end of this article). In 2018-19 a total of 23, 971 GWh of electricity was provided by gas-fired plants across the country. A further 845MW (combined cycle gas turbine plant) and 1837MW of OCGT proposed for the NEM[vi] (see figure 3).
Figure 3: NEM Registered capacity by fuel source and state[vii]
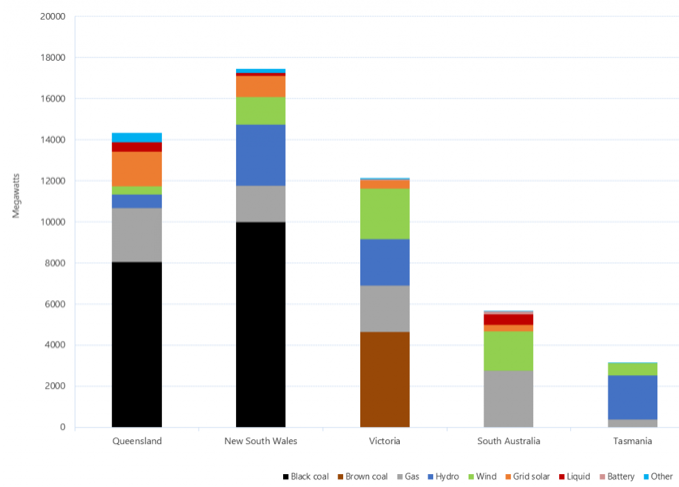
Source: AER, AEMO
The amount of gas generation (and gas required) is likely to shift substantially year to year and beyond weather events and patterns will be impacted by factors like new transmission, the availability of other plant as well as overall energy demand.
In the first quarter of this year, GPG in the NEM decreased by 566 MW on average compared to Q1 2019, largely due to lower operational demand and increased renewable output in southern regions[viii]. There were large reductions in South Australia (down 266 MW) and Victoria (down 148 MW), while there was only a slight reduction in Queensland (22 MW).
In its latest Gas Statement of Opportunities (GSOO)[ix], AEMO’s longer-term forecasts are for relatively flat gas consumption, with a primary reason lower long-term outlook for GPG (see figure 2). This is based on projections of reduced electricity demand, greater interconnection between regions, and more renewable generation.
AEMO has forecast gas demand for GPG to drop in the medium term, with additional transmission and as a result GPG being less relied on for firm supply. As more coal generation retires in the long term, however, demand for GPG is forecast to grow back to near 2020 levels.
Figure 4: Gas consumption actual and forecast, 2010-39, all sectors, Central scenario (PJ)
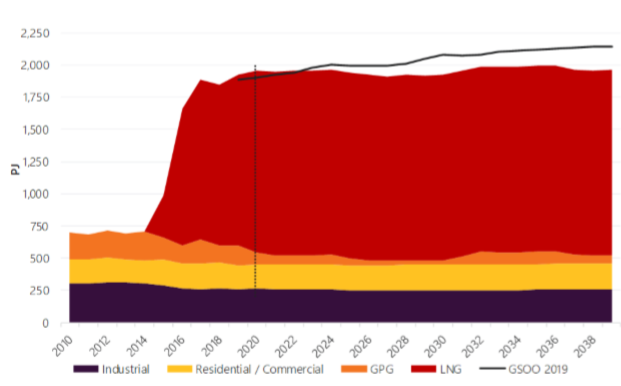
Source: AEMO GSOO 2020
Gas supply crunch
With the demand for gas for generation, LNG exports, residential and commercial use and industrial and manufacturing operations, AEMO has forecast that gas production from only existing and committed gas developments should provide adequate supply until between 2023 and 2025 (depending on the scenario)[x].
Beyond that point, existing and committed southern field projects are forecast to be insufficient to meet southern demand, requiring major southbound pipeline infrastructure upgrades.
AEMO’s GSOO shows gas supply adequacy across the outlook is highly uncertain, particularly between 2022 and 2024 when projected tightness in the east-coast gas supply-demand balance coincides with key uncertainties in the electricity sector that may impact peak day and annual gas supply outlooks.
Factors that could impact gas generation and gas supply include a shift in the timing of forecast new transmission, renewable generation or storage (including Snowy 2.0) developments or if the projects don’t proceed.
Other uncertainties on gas projections include:
- The timing and source of new gas for NSW under a Federal-NSW Government agreement. This is intended to add around 70PJ annually into the state[xi]. Sources could include a proposed Port Kembla (up to 100 PJ)[xii], and Newcastle[xiii] gas import terminals (approximately 110 PJ), and Santos’ Narrabri gas project (approximately 70 PJ)[xiv], which are all considered to be priority projects. If available by the end of 2022, the additional 70PJ has the potential to delay the domestic supply gap by four years.
- In Victoria, the State Government will lift the ban on conventional gas exploration and development for onshore gas fields from July 2021.
- The actual timing of the end of production at existing southern gas fields, which is expected to occur between mid-2023 and mid-2024.
- AGL has proposed a floating LNG import terminal at Crib Point, near Hastings, which is progressing with the approval process. AGL projects that the import terminal should be able to provide gas from 2024 or earlier [xv].
- Changes in industrial activity.
- Oil prices and investment in exploration. Global demand for LNG is a key driver of the Queensland LNG export forecasts, which will be impacted by global LNG prices or the global supply chain (see Gas and wholesale prices: A market at work).
Table 1: List of NEM gas-fuel plants
|
Sum of Reg Cap (MW) |
|
|
Station Name |
Total |
|
Bairnsdale Power Station |
94 |
|
Ballarat Base Hospital Plant |
3 |
|
Barcaldine Power Station |
37 |
|
Barker Inlet Power Station |
211 |
|
Bell Bay Three Power Station |
163 |
|
Colongra Power Station |
724 |
|
Condamine Power Station A |
143 |
|
Darling Downs Power Station |
0 |
|
Dry Creek Gas Turbine Station |
156 |
|
Hallett Power Station |
217 |
|
Jeeralang "A" Power Station |
204 |
|
Jeeralang "B" Power Station |
228 |
|
Ladbroke Grove Power Station |
80 |
|
Laverton North Power Station |
312 |
|
Mintaro Gas Turbine Station |
90 |
|
Mortlake Power Station |
566 |
|
Newport Power Station |
500 |
|
Oakey Power Station |
282 |
|
Osborne Power Station |
180 |
|
Pelican Point Power Station |
478 |
|
Quarantine Power Station |
229 |
|
Roma Gas Turbine Station |
120 |
|
Smithfield Energy Facility |
185 |
|
Somerton Power Station |
170 |
|
Swanbank B Power Station & Swanbank E Gas Turbine |
385 |
|
Tallawarra Power Station |
440 |
|
Tamar Valley Combined Cycle Power Station |
208.6 |
|
Torrens Island Power Station |
1280 |
|
Townsville Gas Turbine |
242 |
|
Traralgon Network Support Station |
10 |
|
Uranquinty Power Station |
664 |
|
Valley Power Peaking Facility |
300 |
|
Yarwun Power Station |
154 |
|
Grand Total |
9055.6 |
Source: AEMO
[i] https://www.energy.gov.au/publications/australian-energy-statistics-table-o-electricity-generation-fuel-type-2018-19-and-2019 - These statistics cover all electricity generation in Australia, including by power plants, businesses and households.
[ii] Technology Investment Roadmap Discussion Paper, May 2020
[iii] Comments to ABC’s Q&A program, 25 May 2020
[iv] See Barker Inlet: A new technology responding to the market
[v] Australian Energy Market Operator
[vi] Australian Energy Market Operator. Australian Energy Council analysis
[vii] Figure shows registered capacity by fuel source in each region for the 2019/20 financial year (as of 1 April 2020).
[viii] Quarterly Energy Dynamics, Q1 2020, AEMO
[ix] Gas Statement of Opportunities, March 2020, AEMO
[x] With the rider that cargoes of export LNG above contracted levels are diverted to meet domestic demand if needed
[xi] Prime Ministerial and NSW Premier Media Release, 31 January 2020
[xii] https://ausindenergy.com/
[xiii] https://www.epiklng.com/ngdc.html
[xiv] https://narrabrigasproject.com.au/
[xv] https://www.agl.com.au/about-agl/how-we-source-energy/gas-import-project
Related Analysis
Where’s the energy for new gas generation?
The importance of gas-powered generation (GPG) to our energy system is well recognised, with system planners and market operators often seeing it as an essential “last line of defence.” The role of gas generation has been further highlighted by two recent papers: the Australian Energy Council’s Energy2050 Vision for the Future Energy System and the policy paper “Are gas turbines ‘bankable’ in energy-only markets?” published by Griffith and Cambridge Universities. Despite this clear and ongoing need, investment in new gas-fired generation remains limited, raising important questions about market settings, policy signals and the future role of dispatchable capacity in a transitioning grid — we take a look.
Winter Bills: Is it cheaper to heat your house with gas or electricity?
As gas and electricity prices continue to fluctuate across Australia’s east coast, households and businesses are facing rising winter energy costs and growing uncertainty. Seasonal demand, household gas consumption, and the efficiency of electric heating systems, particularly when paired with rooftop solar, are playing an increasingly important role in shaping energy bills. Drawing on data from the Australian Energy Council’s Solar Report Q2 2025, this article explores how these factors affect costs and highlights potential savings for households of different sizes.
The energy transition and power bills: Why aren’t they cheaper?
With energy prices increasing for households and businesses there is the question: why aren’t we seeing lower bills given the promise of cheaper energy with increasing amounts of renewables in the grid. A recent working paper published by Griffith University’s Centre for Applied Energy Economics & Policy Research has tested the proposition of whether a renewables grid is cheaper than a counterfactual grid that has only coal and gas as new entrants. It provides good insights into the dynamics that have been at play.
Send an email with your question or comment, and include your name and a short message and we'll get back to you shortly.