
by Australian Energy Council
Energy Dynamics Report - A Tale of Minimum Operational Demand and Wholesale Price declines
The third quarter saw significant price declines compared with the corresponding quarter in 2022 right across the National Electricity Market (NEM). At the same time with increased output from solar PV and wind generation in Queensland’s case, minimum operational demand records were set or equalled in every state across the NEM, while the quarter also saw the highest-ever level of negative prices with all regions showing an increase. We dive into the operational demand and wholesale price details of the Australian Energy Market Operator’s (AEMO) Q3 2023 Quarterly Energy Dynamics Report below.
Minimum Operational Demand
The third quarter saw warmer weather with an And an El Nino event declared by the Bureau of Meteorology on 19 September. This follows three years of declared La Nina events. The quarter also saw average operational demand fall 5.1 per cent compared to the same quarter a year ago with an increase in rooftop solar generation a key factor. Operational demand was 21,270 MW, 1,143 MW lower than Q3 2022. The reporting period recorded the highest ever solar PV output for a third quarter at 2,287 MW, up 535 MW from Q3 2022. New South Wales, Victoria and South Australia set new minimum demand records – NSW (7,721 MW) Victoria (5,126 MW) and South Australia (1,351 MW). Unsurprisingly, these states also recorded their highst solar PV output at the same time (see figure 1 below). Queensland recorded a small increase in quarter-on-quarter demand compared with 2022, likely due to the warmer weather the state experienced.
Figure 1 – Operational demand
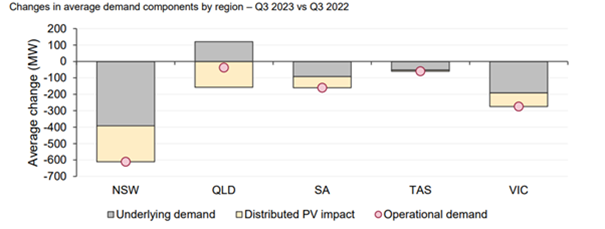
Source: AEMO Quarterly Energy Dynamics October 2023
The impact of solar PV was again on display as maximum demand across the NEM was 30,758MW down 3 per cebt quarter-on-quarter compared with 2022. On a state-by-state basis, the declines were more pronounced, with NSW declining 7 per cent and South Australia by 6 per cent. An all-time minimum demand record for the NEM was set at 12:30pm on Sunday 17 September 2023, with demand falling to 11,393 MW. This was 499 MW lower than the previous record set on Sunday 6 November 2022.
Operational demand lows were recorded or equaled in four states:
|
State |
Minimum Demand |
|
New South Wales |
Equaled its all-time minimum demand record of 4,101MW on Sunday 24 September 2023. The record was set on Sunday 9 April 2023. Solar PV accounted for 46 per cent of generation in the state at the time. |
|
Victoria |
Set a new demand record at the same time NSW equaled its record. Demand was 2,068 – 127 MW lower than the previous record set on Saturday 18 December 2022. |
|
South Australia |
Set a new record low of 21 MW on 16 September 2022. Solar PV accounted for 98.5 per cent of demand (1,396 MW). This record was 79 MW lower than the previous record set on 16 October 2022. |
|
Queensland |
Experienced its lowest operational demand on record since 2002 of 3,387 MW on 17 September 2023. |
Figure 2 – Q3 Minimum Demand for Mainland States
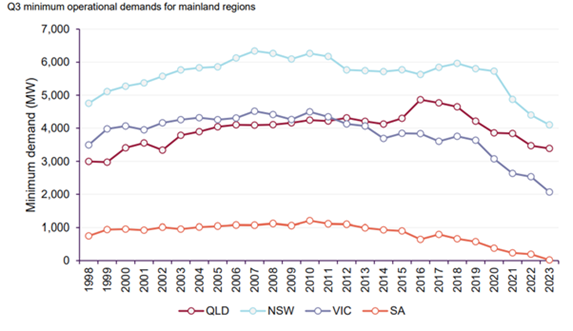
Source: AEMO Quaterly Energy Dynamics October 2023
Wholesale Prices
Wholesale prices were down an average 71 per cent - from $216/MWh in Q2 2022 to $62/MWh in Q3 2023. On 17 November 2022 the Australian Energy Council (AEC) published an EnergyInsider which identified how energy markets were beginning to correct following the massive price increases for coal and gas, which peaked in September 2022. The rationalisation of prices from the peak is reflected in the quarter-on-quarter price change.
It is worth noting that prices in Q3 2023 remain higher than both Q3 2021 and 2020, as can be seen in Figure 3 below.
Figure 3 – NEM average wholesale prices quarterly since Q2 2020
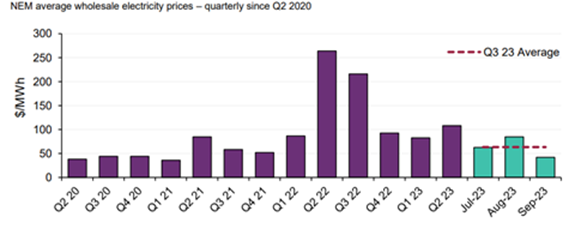
Source: AEMO Quaterly Energy Dynamics October 2023
Factors behind wholesale price changes by state are shown in the table below. South Australia showed the highest volatility in the third quarter, largely in August due to planned outages limiting the flows on the Heywood interconnector. Gas-fired generation entered the market when low wind conditions occurred overnight and backup generation was required.
State-specific figures:
|
Region |
Q3 2022 Price impacts |
|
New South Wales |
Recorded a quarterly average of $81/MWh, a 64 per cent reduction from the Q3 2022 average of $225/MWh. Higher interconnector flows were received from Queensland this quarter compared with the same time last year. |
|
Queensland |
Recorded quarterly average of $65/MWh, a 71 per cent reduction from the Q3 2022 average of $228/MWh. The state recorded a significant quarter on quarter increase in solar PV and wind output compared with the same time in 2022, helping to lower wholesale prices. |
|
Victoria |
Recorded a quarterly average price of $49/MWh, a 74 per cent reduction from the Q3 2022 average of $192/MWh. |
|
South Australia |
Recorded the highest volatility in spot prices of any region, with a quarterly average price of $92/MWh. |
|
Tasmania |
Recorded the lowest average of all the states of $29/MWh. This represents an 86% reduction from the Q3 2022 average of $202/MWh. Lower average prices resulted in a 180 MW increase in exports to Victoria. |
Figure 4 - Average wholesale electricity spot price by region
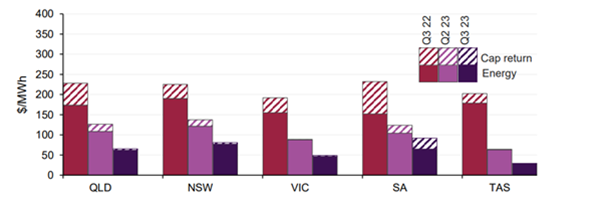
Source: AEMO Quarterly Energy Dynamics October 2023
AEMO has also pointed to the following overall factors for the fall in wholesale prices during the quarterbeing driven down in Q3 2023:
- Black coal lower offer curve - Relative to Q3 2022 there were significant increases in the volume and proportion of output offered at lower price ranges by black coal-fired generators in the northern NEM regions . AEMO cites the introduction of domestic thermal coal price caps over the last year as well as improvements in fuel supplies for key generators. Increasing renewable output in northern regions along with lower operational demand meant there was less reliance on and dispatch of thermal generation. Available black coal capacity in Queensland and New South Wales ran at a lower utilisation rate, averaging 75 per cent this quarter compared to 80 per cent in the same period last year.
- Lower underlying and operational demand – As highlighed above the combination of mild weather which reduced underlying demand and strongly increasing solar PV output led to the largest year-on-year fall in NEM operational demand.
- New and commissioning VRE capacity in the NEM - During the third quarter there was a 425 MW increase in grid-scale solar availability compared to Q3 2022. Additional wind farm capacity contributed a 211 MW increase to available supply.
- Price volatility events - Significant price volatility was only evident in South Australia during August when Heywood interconnector capacity was limited over several periods due to line outage works. During these outage periods, some instances of low wind generation resulted in price volatility. A significant portion of the quarterly total cap return for South Australia occurred in intervals where the limit on flows from Victoria via Heywood was binding at 50 MW or lower, compared to a normal capacity of up to 600 MW. Occasional low wind conditions in Victoria in August resulted in isolated price spikes in all mainland regions. See Table 2 (in Section 1.2.2) for more information on price volatility events.
- Lower hydro offer curve - Tasmania had the lowest quarterly price of all NEM regions at $29/MWh. Slightly lower demand, windy conditions (resulting in an increase of 65 MW in average wind generation), increased hydro availability and a significant reduction in hydro offer pricing relative to Q3 2022 were the key factors.
Negative Wholesale Prices
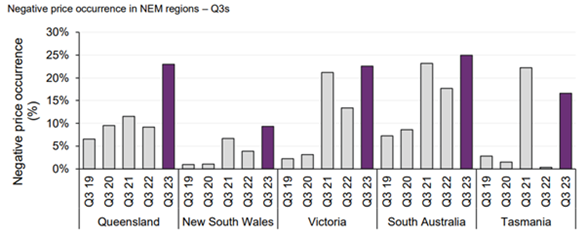
- Before this piece is finalised, it must be noted that Q3 2023 recorded the highest-ever level of negative prices with 19 per cent of all intervals recorded negative prices. The lower demand reflecting increased renewable output in the NEM led to a significant increase in negative price occurrence. This was often being set by renewable generators offering energy at negative levels to reflect the value of Large Generation Certificates, according to AEMO. Queensland saw the greatest increase in negative price occurrences relative to Q3 2022.
Negative prices are concentrated in daylight hours, reflecting in particular the availability of solar PV. Figure 5 below shows the occurrence of negative prices across all regions of the NEM.
Figure 5 – Negative Price Occurrence in NEM regions
Source: AEMO Quaterly Energy Dynamics October 2023
Related Analysis
Australia’s Home Battery Surge: A Question of Equity
Australia is a global leader in rooftop solar, with more than 4.3 million households and small businesses installing photovoltaic (PV) systems as of February 2026. Battery uptake has also accelerated, particularly since the introduction of the Cheaper Home Batteries Program in July 2025, which offers around a 30 per cent upfront discount for systems between 5 kWh and 100 kWh. More than 236,000 batteries had been installed by February 2026, although this likely understates the true figure due to reporting lags; the Federal Government has since indicated installations have surpassed 250,000 as of March 2026. Despite this rapid growth, an important question remains: who is actually benefiting from these subsidies?
Integrated System Plan – What Should We Expect?
The release of an expert study of last year’s autumn wind drought in Australia by consultancy Global Power Energy[i] this week raised some questions about the approach used by the Australian Energy Market Operator’s in its 2024 Integrated System Plan (ISP). The ISP has been subject to debate before. For example, there has previously been criticism that some of the ISP’s modelling assumes what amounts to “perfect foresight” of wind and solar output and demand[ii], rather than a series of inputs and assumptions. The ISP is produced every two years and with the draft of the next ISP (2026) due for release soon, it is useful to consider what it is and what it is not, along with what the ISP seeks to do.
Getting it right: How to make the “Solar Sharer” work for everyone
On paper, the government’s proposed "Solar Sharer Offer" (SSO) sounds like the kind of policy win that everyone should cheer for. The pitch is delightful: Australia has too much solar power in the middle of the day; the grid is literally overflowing with sunshine: let’s give households free energy during 11am and 2pm. But as the economist Milton Friedman famously warned, "There is no such thing as a free lunch." Here is a no-nonsense guide to making the SSO work.
Send an email with your question or comment, and include your name and a short message and we'll get back to you shortly.