

by Duncan MacKinnon
Down, down, are SA Prices down?
There have been reports that over the past few months that South Australia’s wholesale electricity prices have been below those in Victoria and NSW, a consequence of “steps taken by the Australian Energy Market Operator and the Weatherill government to ease the state’s energy reliability problems”[i]. Is this a reasonable assessment? We take a look at the data.
The data
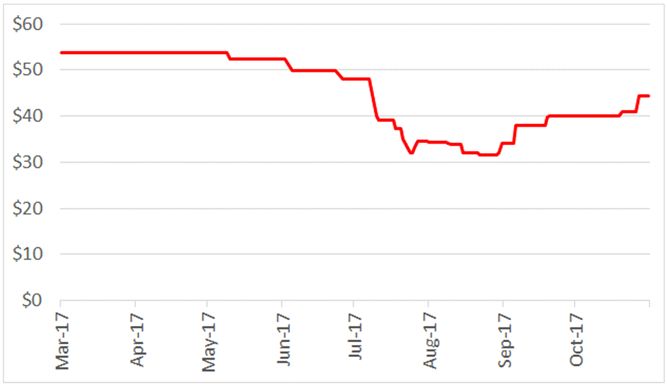
Since March it is correct to say that South Australian prices have been reducing (see Figure 1). October’s volume-weighted average monthly price was about 4.5 per cent lower than Victoria’s, the next closest mainland state – but this only shows part of the picture.
Figure 1: Mainland NEM Monthly Volume-Weighted Average Prices
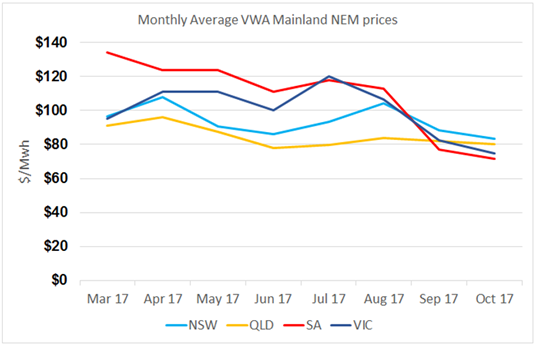
Source: AEC analysis of NEM data
In fact, if this year’s March to October period is compared with the same period last year (Figure 2), SA prices are in fact higher than last year (after excluding the significant increases in June and July 2016 during the Heywood interconnector upgrade).
Figure 2: SA Monthly Volume-Weighted Average Prices
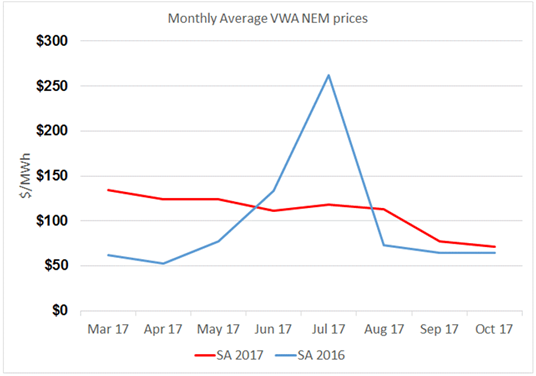
Source: AEC analysis of NEM data
If a longer snapshot of SA’s prices over the past 22 months is considered (Figure 3), it can be seen that there is significant variation, which reflects the myriad variables which interact to determine market prices.
Figure 3: SA Monthly Volume-Weighted Average Prices
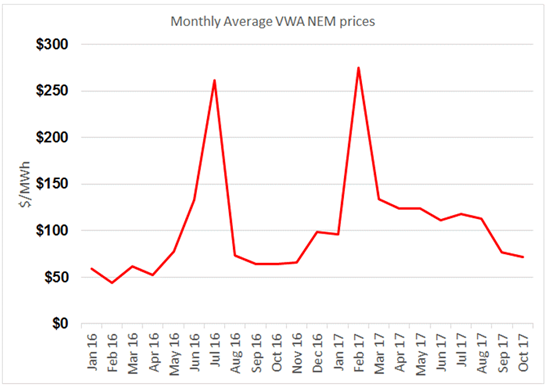
Source: AEC analysis of NEM data
Spring is typically a period of low prices, as wind resources increase and demand reduces due to lower heating loads, so the prices shown in the charts are not unexpected. In fact, the additional wind farm generation often leads to periods of excess generation when interconnectors reach their export limits, and as a consequence the South Australian prices fall below zero, and sometimes to the market floor price of minus $1,000 per MWh. Whilst this does reduce the monthly average somewhat, it is not a healthy indicator, symptomatic of the volatility of the region.
During periods of very low prices, occurring when there is high wind output, thermal generation can’t recover its costs and understandably wishes to shut down. Yet to maintain power system security AEMO needs certain services from these synchronous power stations, and AEMO directs thermal generation to continue operating. Since March this year, AEMO has directed market participants to stay online 16 times. AEMO compensates the directed generators and this has resulted in additional costs of more than $2 million being passed on to SA consumers. (These costs are not part of the wholesale price and are not reflected in the graphs).
Of course excess wind is not always the case, and there is significant fluctuation between months. Figure 4 shows the monthly wind farm capacity factors for SA wind farms, which shows wind output varies not only day by day, but also month by month. The power system needs to adjust around these variations, and prices are one indicator of this.
Figure 4: Monthly SA Wind Farm Capacity Factors
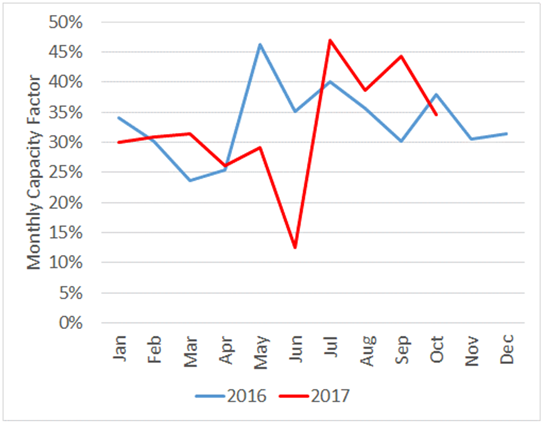
Source: AEC analysis of NEM data
AEMO and SA Government Summer Plans
The news article suggested that “steps taken by the Australian Energy Market Operator and the Weatherill government to ease the state’s energy reliability problems” have reduced prices in SA.
According to the SA Government’s Our Energy Plan[ii], the projects are:
- Tesla’s 100MW 129MWh battery adjacent to the Hornsdale Wind Farm;
- 276MW of hybrid diesel-fired generation, which has now been connected to the grid[iii];
- a new gas-fired power station (which is expected to be developed by combining the hybrid generators, which can also run on gas);
- emergency powers for the Minister for Energy;
- a retailers’ energy security target;
- South Australian gas incentives; and
- a whole of SA Government electricity supply tender.
AEMO has a six-point plan[iv] to prepare for summer 2017-18, which includes:
- supply availability;
- fuel availability;
- network availability;
- peak demand response;
- resilience; and
- recovery and operational changes.
While these plans are currently being implemented, apart from a minor 561MWh generated by the diesel-fired generators while testing, all of these measures are yet to operate, and so cannot be linked to recent price outcomes. Nor do they seem to be affecting the market’s view of the future as seen in the contract market. Figure 5 is a graph of SA Q1 2018 $300 cap prices, which shows that prices are rising as summer draws closer.
Figure 5: ASX Energy SA Q1 2018 $300 Cap Futures Price
Source: AEC analysis of ASX Energy data
Furthermore, these cap prices, as shown in Figure 6, remain higher than the other mainland National Electricity Market (NEM) states, putting paid to the misapprehension that SA prices are cheaper than other states. This relationship, in which SA exhibits prices higher than the other mainland NEM states, holds true for other derivative products as well.
Figure 6: ASX Energy Q1 2018 $300 Cap Prices
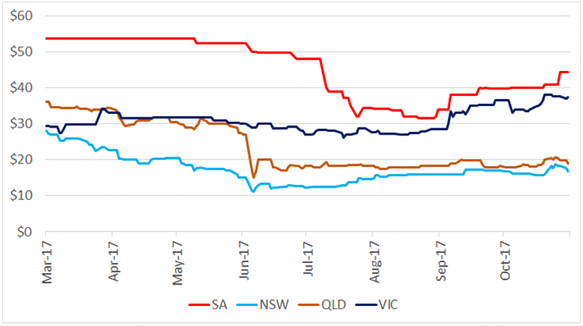
Source: AEC analysis of ASX Energy data
Conclusion
There is no indication in the data that SA’s prices have declined for any reason other than natural variability, heavily influenced by seasonal conditions, and the contract data suggests that there is no change to the outlook that SA is likely to remain the region with the highest prices on average.
[i] Australian Financial Review, 7th November, p.5.
[ii] https://service.sa.gov.au/cdn/ourenergyplan/assets/our-energy-plan-sa-web.pdf
[iii] “Green power” Premier hooks up dirty generators, The Australian, 14 November 2017.
[iv] National Electricity Market Wholesale Consultative Forum (NEMW-CF) Minutes dated 13th October 2017, available at http://www.aemo.com.au/Stakeholder-Consultation/Industry-forums-and-working-groups/Wholesale-meetings/NEM-Wholesale-Consultative-Forum
Related Analysis
Beyond the “loyalty penalty”: unlocking CER value is the real pathway to a services market
The Australian Energy Market Commission pricing review has sparked debate about fairness and competition, with the AEC cautioning against treating price differentials as the core problem. Recent evidence from the ACCC suggests competition and recent reforms are improving customer outcomes with the AEC arguing that a true shift to a services-based market will depend on unlocking and fairly sharing CER value, not weakening the competitive dynamics that drive innovation. We outline our position on the review. Read more.
A New Year: New regulated offer; new records but some old challenges
A new year has brought major developments across Australia’s energy markets, with new regulatory interventions alongside record-breaking renewable generation. The Federal Government’s Solar Sharer Offer marks a significant shift in retail market design, while the wholesale market delivered historic renewable output and much lower prices, driven largely by strong wind and growing battery capacity. We take a look at what these changes mean for customers, retailers and the reliability of the power system, and where old challenges continue to resurface.
2025 Another Year Full of Energy (Developments)
2025 has been another year in which energy-related issues have been front and centre. It ended with a flurry of announcements and releases, including a new Solar Sharer tariff proposed by the Federal Government and the release of the 2026 Integrated System Plan (ISP) draft. Below we highlight some of the more notable developments over the past 12 months.
Send an email with your question or comment, and include your name and a short message and we'll get back to you shortly.