
by Carl Kitchen & Blaine Wang
Cryptocurrency drives energy demand
Cryptocurrency and the best-known form, Bitcoin, has become more widespread over the past few years with more than 3 million Australian’s now owning cryptocurrency.
While the key focus around Bitcoin has been on the staggering prices it can attract, along with its volatility, increasingly there is also a focus on the scale of its demand for electricity and the implications for grids and carbon emissions.
The massive computing systems needed to validate transactions and create cryptocurrencies - better known as ‘mining’ - consumes significant amounts of power. The increasing scale of cryptocurrency mining operations is illustrated below:

Source: New York Times
Riot Blockchain, the largest miner in the US, has 120,000 computers at its facility in Rockdale while an estimated 2.9 million specialised hardware devices competed in the Bitcoin ‘proof-of-work’ (explained below) and generated 160 quintillion guesses per second globally last year.
Bitcoin’s global network of miners is estimated to demand up to 15GW of power while unlocking a single Bitcoin requires an estimated 150,000 kWh of electricity. Annually that adds up to an estimated 130TWh - slightly more than Norway and Sweden use, and just behind Egypt and Poland. It is also estimated Bitcoin mining may be responsible for 65.4MtCO2 annually, comparable to the emissions from Greece’s economy (56.6MtCO2) and 0.19 per cent of global emissions.
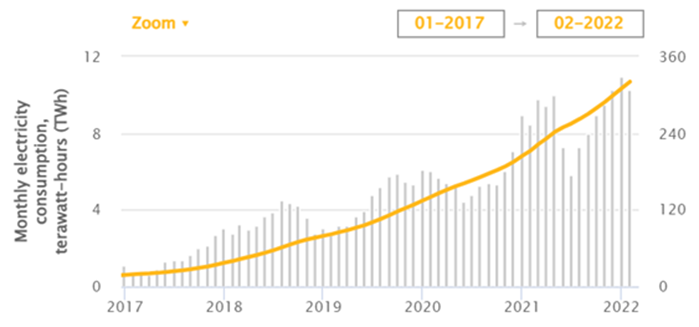
The increasing demand on electricity systems has seen Cambridge University create an electricity consumption index to track demand from cryptocurrency creation, its recent trends are shown below.
Figure 1 shows the energy demand for Bitcoin creation over the past five years, including maximum and minimum demand levels in the shaded areas, while figure 2 highlights the monthly electricity demand and cumulative demand since 2017.
Figure 1: Electricity demand from Bitcoin mining 2017-2022

Source: Cambridge University Bitcoin Electricity Use Index
Figure 2: Total electricity consumption: Bitcoin
Source: Cambridge University Bitcoin Electricity Use Index
Bitcoin background
Bitcoin was launched in 2009 as a peer-to-peer version of electronic cash to allow online payments to be sent directly between parties and avoid financial institutions, although cryptocurrencies have become more a pure speculative play.
The challenge was to develop a system to validate transactions without a middleman – this is where the Bitcoin network or miners comes in. They confirm whether the Bitcoin is real via computing – the ‘proof-of-work’. New sets of transactions or blocks are added to Bitcoin’s blockchain every 10 minutes. Bitcoin transactions are verified by other users of the network, via the process of compiling and confirming transactions (‘mining’). It requires the solving of codes with miners competing to make the validation first and receive Bitcoin in return. Then the cycle repeats.
According to the Reserve Bank of Australia, the supply of Bitcoins increases at a pre-determined rate and is capped at around 21 million, so its supply is often compared to the supply of gold, as another scarce commodity. That scarcity is also reflected in the value of cryptocurrencies (on 2 March Bitcoin was trading at around USD44,0000). Gold mining also accounts for a similar electricity demand of 131TWh. Given the potential returns it’s not surprising businesses are devoting more computing power to the challenge. The graphic below gives an idea of how Bitcoin mining compares with other activities in its grid demand.
Figure 3: Power use by activity

Source: CCAF. AC = Air conditioners
Energy Use
Electricity is a major cost for cryptocurrency miners and data centres (previously covered here). Globally electricity prices paid by miners average USD0.05 per kWh.
Figure 4: Cost breakdown for cryptocurrency miners by region
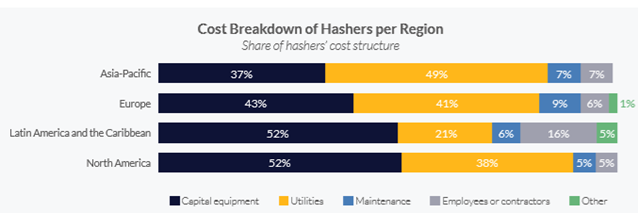
Source: CCAF
In its third benchmarking survey of crypto assets published last September, Cambridge University’s Centre for Alternative Finance (CCAF) shows the majority of miners are now entering power purchase agreements with generators and are looking at different ways to keep their energy costs down.
While China allowed Bitcoin mining, hydroelectricity was the main power source while other renewables - wind and solar – were ranked behind coal and natural gas. This is driven by the need for a consistent power supply by the majority of miners given the nature of their operations.
But some miners are starting to seek to act as a “shock absorber” for additional renewable capacity by entering arrangements to buy excess electricity when supply is high and other demand low and entering demand response arrangements to shut down their systems when demand is high and supply low. Riot Blockchain in Texas has entered a 10-year contract power purchase agreement with a USD 0.05 discount to participate in demand response.
Some cryptocurrencies are looking at modifying their processes. Ethereum, another cryptocurrency, has sought to move from proof-of-work to a proof-of-stake model, that is expected to significantly cut energy use. Another, Candela, also has a protocol requiring solar power mining.
But in the short to medium term there seems little prospect that Bitcoin will lose its spot as the major cryptocurrency (it has a market cap larger than the next five most valuable cryptocurrencies combined) so it is likely to continue to drive energy demand, particularly baseload demand.
The demand for energy from cryptocurrencies has also resulted in uneconomic plant returning into service to meet the new demand. Greenidge Generation is an integrated Bitcoin miner and power generator and was involved in bringing a 106MW power plant, which was mothballed in 2011, back into operation after being converted to natural gas (from coal) in 2017 in New York State.
It’s anticipated in the shorter term older plant will continue to be brought back into operation, or have their life extended, to meet the needs of crypto mining operations. There have also been attempts to use flare gas from oil and gas fields in United States with one company, Crusoe Energy Systems, reportedly diverting 10 million cubic feet of gas a day to power Bitcoin operations.
Last year China cracked down on Bitcoin mining pushing it offshore and leading to a drop in the share of renewables being used to power the network from 41.6 per cent to 25.1 per cent. The major factor was that miners had been able to access hydroelectricity in China’s Yunnan and Sichuan provinces during the wetter months. China had accounted for an estimated 44 per cent of total Bitcoin mining internationally. Since its crackdown, major miners have moved to Kazakhstan and the United States and are drawing more power from coal-fired and gas-fired generation, and it is estimated that gas in the energy mix for creating Bitcoins has doubled from around 15 per cent to 30.8 per cent as a result. At the same time, coal-fired generation in Kazakhstan is subcritical and considered less efficient than other regions.
With that has come the increasing concern about Bitcoin and cryptocurrencies’ demand on electricity grids. Earlier this year, it prompted US Democrat Senators to push for information on the electricity use and carbon emissions from six of the world’s biggest miners. The representatives requested information on the annual electricity consumption of Bitcoin facilities, their growth plans as well any impact their operations might have on local power prices.
Related Analysis
Data Centres and Energy Demand – What’s Needed?
The growth in data centres brings with it increased energy demands and as a result the use of power has become the number one issue for their operators globally. Australia is seen as a country that will continue to see growth in data centres and Morgan Stanley Research has taken a detailed look at both the anticipated growth in data centres in Australia and what it might mean for our grid. We take a closer look.
Energy Dynamics Report - A Tale of Minimum Operational Demand and Wholesale Price declines
The third quarter saw significant price declines compared with the corresponding quarter in 2022 right across the NEM. At the same time with increased output from solar and wind generation inin Queensland’s case, minimum operational demand records were set or equaled in every region. The quarter also saw the highest-ever level of negative price intervals with all regions showing an increase. We dive in to the pricing and operational demand detail of AEMO’s Q3 Quarterly Energy Dynamics Report.
Data centres: A 24hr power source?
Data centres play a critical role in enabling the storage and processing of vast amounts of online data. However they are also known for their significant energy consumption, which has raised concerns about their environmental impact and operating costs. But can data centres be fully sustainable, or even a source of power?
Send an email with your question or comment, and include your name and a short message and we'll get back to you shortly.