

by Carl Kitchen
Cost of coal: “Most important, but overlooked” factor in power prices
Two reports landed this week that provide some good insight into the state of coal-fired and renewable generation in the National Electricity Market (NEM).
The reports from BloombergNEF (BNEF) and EnergyQuest offer insight into the factors at work.
BNEF’s report, 2H Australia Power Market Outlook, shows that the cost of coal power generation in the NEM has doubled from 2016 levels, in line with seaborne thermal coal prices.
BNEF notes that with black coal accounting for around 54 per cent of the NEM’s generation mix (compared to 51 per cent in 2016) the increase in the cost of coal generation “is one of the most important, yet overlooked, factors driving up power prices”.
Black coal generation is producing more power following the closure of several brown coal plants, including Hazelwood in Victoria and Northern in South Australia, which has forced operators to source more fuel at spot market prices that have risen.
According to BNEF’s lead author Ali Asghar the result is that they have to charge more for their power and thousands of megawatts of coal capacity that had been offered at $20-40 per megawatt hour (MWh) during most of 2016 was now available at $40-60/MWh, which is shown in Figure 1 below.
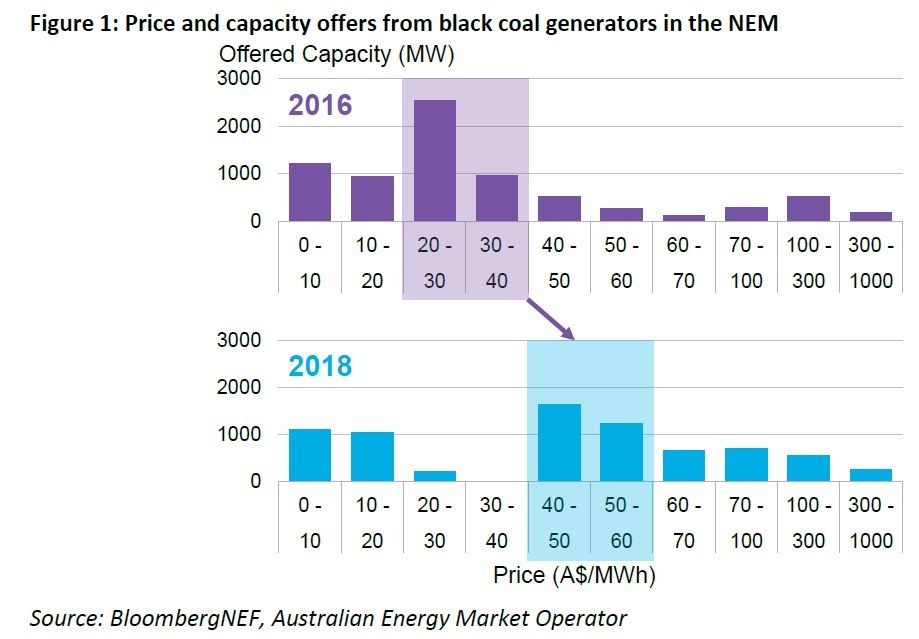
With black coal-based generation making up a large proportion of the NEM’s energy mix it is often setting the average base for power prices in the NEM. The increase in generation from coal is the major factor behind the 60-100 per cent increase in average wholesale power prices over the past two years, according to BNEF.
Asian Demand
A key factor in the higher coal price is the demand for Australian coal in Asia. BNEF reports that depending on the grade seaborne thermal coal prices have gone from A$55-75 per metric ton in early 2016 to A$90-160/ton in August this year (that can be seen in figure 2 below).
Figure 2: Rising international thermal coal prices are impacting power prices
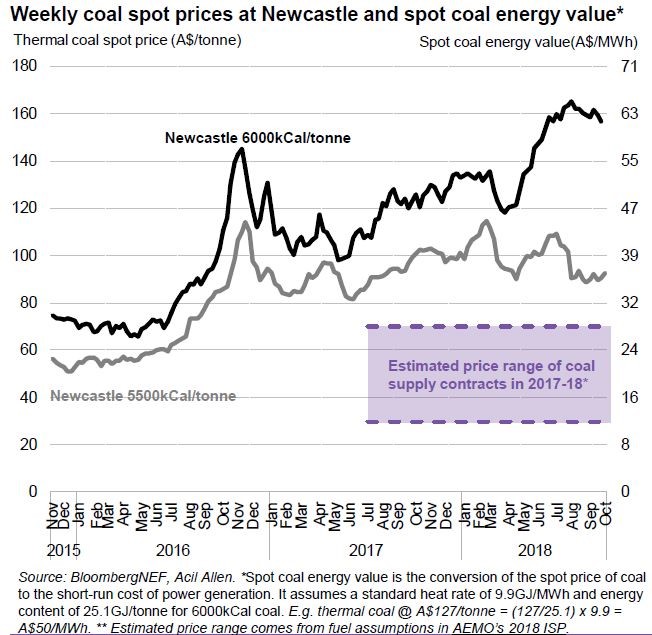
Thermal coal prices at the Newcastle hub have been steadily rising over the past three years. BNEF points to increased international coal prices having a knock-on effect in the NEM.
This can result from most coal generators without a “captive” source of supply potentially being partially exposed to the coal spot market. While most feedstock is through long-term supply contracts, occasional spot purchases may be need for marginal generation.
With the closure of coal power plants like Hazelwood and Northern there has been increased generation from the remaining fleet “requiring coal consumption above their contract supply”. The extra coal supply is linked to the spot price.
BNEF’s report comments that coal-fired power stations’ price setting bids have increased by 50-150 per cent this year relative to 2016, which is in line with the changing prices for export grade black coal at the Newcastle hub over the past two years. It is most notable for rail-linked plants which are more exposed to export markets, while mine-mouth plants continue to dispatch at low <a$20 mwh=""></a$20>
This is in fact exactly how the NEM, or any other commodity market for that matter, is supposed to work. Competing producers change their prices in line with their marginal costs. In the case of those generators using export linked black coal, they are “price makers”, and are rationally reflecting these higher costs into the sale prices of their products. The mine-mouth generators in this case are “price-takers”, and, as with price takers in other commodities, during these times of higher prices they are naturally more profitable than at other times. If this is sustained, it should encourage new investment.
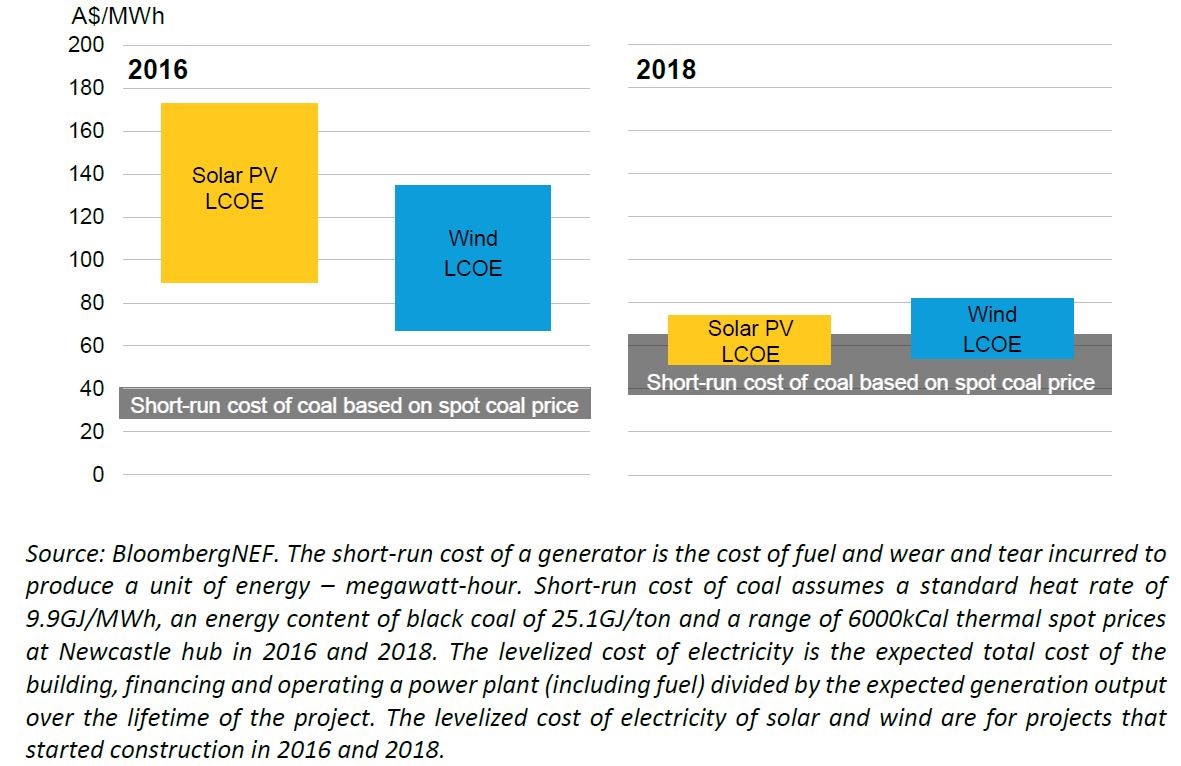
BNEF argues that the silver lining is the increased competitiveness of solar and wind and its model shows that the levelised cost of electricity (LCOE) of new wind and solar PV plants in some cases is now lower than the current short-run marginal cost of thermal coal bought on the spot market (see figure 2). This comparison of course doesn’t consider the variable nature of these sources which tend to earn less in the market over time – another intended NEM outcome. Nevertheless, the implication is that the owner of this sort of black coal might wish to retain its capacity for “firming” purposes, whilst considering installing solar and wind as an alternative to buying expensive marginal coal.
Figure 3: Short-run cost of coal versus levelised cost of electricity of wind and solar
EnergyQuest Assessment
Leading energy economics group EnergyQuest in its latest quarterly assessment also highlights that coal continues to be the mainstay of generation in the NEM. While third quarter coal-fired generation was the third-lowest since Q4 2014, coal plants still accounted for 70 per cent of electricity generation. Although electricity generated from coal-fired power plants was down in NSW and Queensland compared with the same period last year, coal-fired generation in Victoria actually increased.
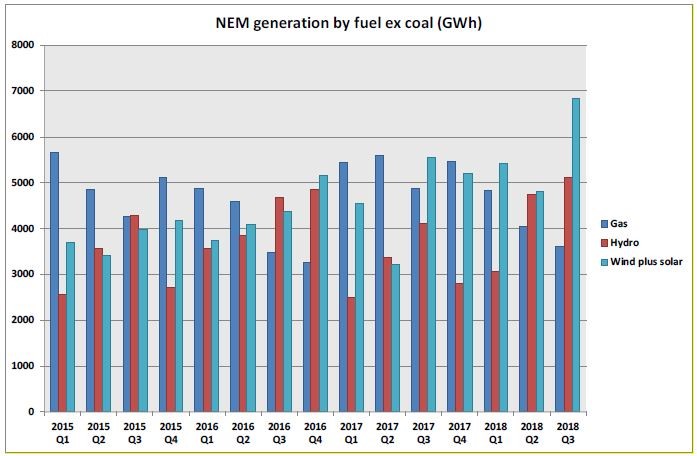
EnergyQuest notes that the big loser in third quarter was gas generation – down 25 per cent quarter on quarter - which impacted by the growth in renewables. Gas generation fell by 1.3 TWh while coal was only down 0.5 TWh. Figure 4 shows the drop in gas generation and growth in renewable output.
The third quarter saw record use of solar (up 38.3 per cent) and wind (up 16 per cent) for electricity generation, while hydro power was at its highest level in more than five years. Renewables, excluding hydro, increased 23 per cent quarter-on-quarter and made up 13.2 per cent of NEM output.
Figure 4: NEM generation by fuel ex coal (GWH)
Source: AEMO, Department of the Environment and Energy, EnergyQuest, 2018
The two reports highlight that ongoing dominance of coal in the NEM. BNEF’s highlighting of coal costs reinforces the issue flagged in the Australian Energy Regulator’s December 2017 assessment of NSW wholesale prices[i] with coal costs and their impact on the costs of generators who purchased coal under short-term contracts highlighted.
[i] AER, 2017, https://www.aer.gov.au/system/files/NSW%20electricity%20market%20advice%20-%20December%202017_0.PDF
[ii] BloombergNEF, 2H Australia Power Market Outlook, 2018, https://about.bnef.com/
[iii] EnergyQuest, Energy Quartlerly, 2018, https://www.energyquest.com.au/reports
Related Analysis
Beyond the Rules: Lessons from the UK on Supporting Energy Consumers Experiencing Vulnerability
Customer vulnerability in the energy sector rarely follows a predictable path, often emerging through financial pressure, illness or sudden life disruption. The United Kingdom’s experience shows that early intervention, flexible support, trusted communication and coordinated care can significantly improve outcomes for households at risk. We explore what Australia can learn from the UK’s evolving approach to supporting customers experiencing vulnerability.
Network Tariff Reform: From Cost Recovery to Coordination in a High-CER System
Network tariff reform has shifted from a technical pricing issue to a central challenge for Australia’s future energy system, shaping affordability, market design and the transition to a customer-centric grid. Recent modelling by the Australian Energy Market Commission provides a timely and valuable contribution to this debate, with one of the most consequential ideas in its Pricing Review reform package being Recommendation 6—proposing that networks develop tariffs for retailers, rather than directly for end-use customers. We take a closer look at the implications.
Addressing Energy Affordability Needs More Than Short-Term Relief
The conflict in the Middle East has continued to highlight the challenges we face in ensuring energy supply remains accessible and affordable for everyone. Ensuring Australia becomes more resilient to international energy price shocks will dominate the energy policy landscape for some time, and rightfully so. But while political debate often gravitates toward regulatory interventions and subsidies that deliver short term household bill relief, the real solution lies in something far more complex: reshaping how the energy system works for consumers. What’s increasingly clear is that energy affordability is not just about price - it’s about design. That is why the AEC is releasing its Affordability Action Agenda today – an 8-point plan of critical actions that industry and governments need to take to ensure that energy remains accessible and affordable for all Australians. Read more.
Send an email with your question or comment, and include your name and a short message and we'll get back to you shortly.