

by Carl Kitchen
A minimum requirement: Managing the demand drop
The challenge posed by falling minimum demand was again in the spotlight this week with the release of the latest supply assessment by the Australian Energy Market Operator (AEMO).
The 2021 Electricity Statement of Opportunities (ESOO) highlights the major impact the increasing amount of distributed PV, particularly solar systems going on household rooftops is having on managing the grid. In its central scenario the market operator expects to see nearly 9GW of PV installed within the next four years, on top of 14GW of capacity already installed.
One outcome of this continuous growth is that each mainland National Electricity Market (NEM) region can expect to see minimum demand occur in the middle of day from now on. This has become increasingly evident since 2018-19 when around 75 per cent of minimum demand events in these regions occurred between midday and 2:30pm.
Individual states have already had to contend with the challenge of increasing periods of minimum demand with South Australia leading the way – that state has achieved periods of up to 78 per cent of underlying demand being met by rooftop solar and the market operator expects that under some scenarios distributed solar could be supplying 100 per cent of underlying demand at times as early as this spring. In other states distributed PV has met up to 42 per cent underlying demand in Victoria, 38 per cent in Queensland, and 32 per cent in New South Wales.
On 10 October last year a record of 35 per cent of underlying demand in the mainland NEM[i] (excluding Tasmania) was met by distributed PV and operational demand hit a new minimum record of 13.6GW. Within five years AEMO expects rooftop solar to supply up to 77 per cent of underlying demand in mainland NEM regions at times.
The extent of the shift expected is underlined by the forecast that minimum demand could be in a range of around 4-6GW by 2025 in all mainland NEM regions (central scenario, see figure 1). The market operator has also flagged that “extreme actions” might be required in some circumstances if operational demand fell below that threshold and there is not action to address the operational challenges. AEMO estimates that 4-6GW is the minimal operational demand required with its present operational toolkit.
Figure 1: Minimum demand in NEM mainland
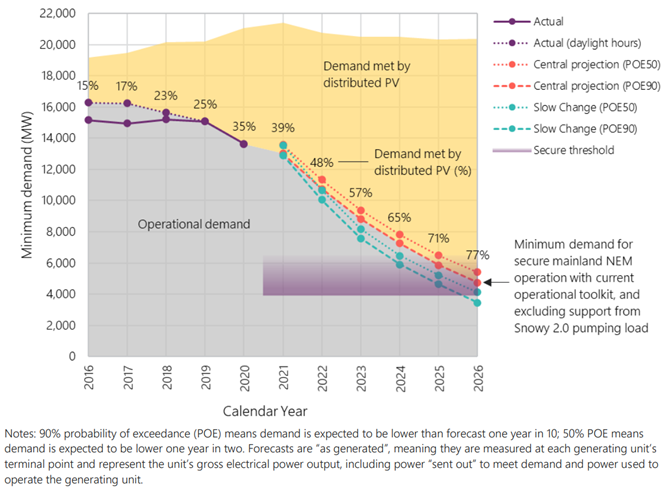
Source: AEMO, 2021 ESOO
Across the Bass Strait, while Tasmania has had several midday minimums these have tended to be driven by reductions in large industrial loads. But in future AEMO expects to start to see minimum demand occur in middle of the day in the Apple Isle as well.
An early challenge
In the short-term, mainland NEM jurisdictions are expected to see minimum demand fall rapidly with the expectation of more distributed PV compared to the 2020 ESOO, and this is expected to accelerate the need for complementary market-based and operational support earlier than previously forecast.
This decline will become more subdued the closer we get to 2030-31 (the end of the 10-year projections in the ESOO) with the forecast growth in electric vehicles and battery storage shifting some of the demand dynamics.
But in the meantime it is posing increasing challenges to the operation of the grid. There are thresholds for demand beyond which the stability of the grid is challenged, and the market operator expects those threshold levels to be reached within five years in the whole mainland NEM. Even when Snowy 2.0 starts operating, the additional load resulting from its pumped storage is still not considered enough on its own to address long-term system security challenges.
The fundamental issue, as outlined in the ESOO, is that minimum operational demand driven by rooftop solar largely represents uncontrolled demand. AEMO has flagged a number of areas where the increased volume of rooftop solar gives rise to challenges and where adaptations are needed:
- ensuring sufficient operational demand for delivery of essential system security services;
- managing and minimising the unintended disconneciton of distributed PV; and,
- maintaining transmission voltages, a sufficient emergency under-frequency response and the ability to perform a system restart.
Extreme action
While there is an expectation that NEM mainland operational demand could reach the 4-6GW range by 2025 (if not earlier under some scenarios) there is a concern that increasingly challenging periods could occur in some periods before those levels are reached. This would arise if there were abnormal circumstances, such as network and/or plant unit outages, or as a result of extreme events like bushfires and storms. At the same time, some of these challenging periods could occur earlier for individual regions in circumstances where they are islanded.
The ESOO warns that if operational demand falls below the 4-6GW range “it will become increasingly necessary to take extreme actions”. Those could include selectively disconnecting whole distribution feeders where they are feeding electricity back into the grid. Disconnecting feeders would increase the operational load, but it “also means that all consumers on the feeder lose power supply”. This would be done to avoid the potential for a black system.
Based on the current operational capabilities in the system consumers on feeders with high levels of rooftop solar could be without power “potentially for extended periods during daylight hours” and “potentially on repeated days during shoulder seasons” - spring and autumn which is when minimum demand often occurs due to milder weather accompanied by plenty of sunshine.
If shedding consumer feeders is not sufficient to recover enough load in some regions there would be the risk of a contingency event, such as generator trip or network fault leading to a “cascading failure to a black system”.
The operator is concerned that if there aren’t adaptations to the system “it is foreseeable that there could be extended periods for many hours during the middle of the day and over repeated consecutive days where the NEM or parts of the NEM may not be secure”.
Adaptations
The market operator points to adaptations under the categories of:
- Social licence for active DER management.
- Adapted market and regulatory frameworks – with most distributed energy resources passive there is a need better align consumer incentives with power system needs. Some steps already underway include the Energy Security Board’s Post 2025 work and the recent Australian Energy Market Commission rule change on access, pricing and incentive arrangements
- Foundational security adaptations – the market operator sees risks can be mitigated and distributed PV better supported if a Contingency and Minimum System Load (CMSL) framework is introduced for use in “rare circumstances”. This would have a tiered market and operational response and measures that can be escalated to maintain system security. This could include a last resort measure of distributed PV curtailment capability for all new installations. This was introduced as a mandatory requirement in SA in September last year.
- Emerging opportunities for stakeholders – including the valuing of services that are not yet fully valued, these could be in areas like frequency control services, load management, energy storage, generator and load flexibility.
[i] Mainland NEM regions are NSW (including the ACT), Victoria, Queensland and South Australia. The full NEM includes Tasmania in addition to these regions.
Related Analysis
Retail protection reviews – A view from the frontline
The Australian Energy Regulator (AER) and the Essential Services Commission (ESC) have released separate papers to review and consult on changes to their respective regulation around payment difficulty. Many elements of the proposed changes focus on the interactions between an energy retailer’s call-centre and their hardship customers, we visited one of these call centres to understand how these frameworks are implemented in practice. Drawing on this experience, we take a look at the reviews that are underway.
Data Centres and Energy Demand – What’s Needed?
The growth in data centres brings with it increased energy demands and as a result the use of power has become the number one issue for their operators globally. Australia is seen as a country that will continue to see growth in data centres and Morgan Stanley Research has taken a detailed look at both the anticipated growth in data centres in Australia and what it might mean for our grid. We take a closer look.
Green certification key to Government’s climate ambitions
The energy transition is creating surging corporate demand, both domestically and internationally, for renewable electricity. But with growing scrutiny towards greenwashing, it is critical all green electricity claims are verifiable and credible. The Federal Government has designed a policy to perform this function but in recent months the timing of its implementation has come under some doubt. We take a closer look.
Send an email with your question or comment, and include your name and a short message and we'll get back to you shortly.