

by Carl Kitchen
Will going offshore work for our grid?
Recent media reports have flagged the potential development of Australia’s first offshore wind farm, which is being proposed just off Victoria’s Gippsland coast. The proponents, Offshore Energy Pty Ltd (OEPL), have begun studies into wind and wave conditions to determine the feasibility of their Star of the South wind farm[i].
The Federal Government granted OEPL (which includes Copenhagen Infrastructure Partners P/S) an exploration licence earlier this year to carry out a range of site and resource investigations[ii]. The licence allows OEPL to undertake exploration in Commonwealth waters about eight to 13 kilometres off the Gippsland coast.
A final decision on what is touted as an $8-10 billion[iii] project remains some way off. OEPL has not been given any rights to develop or operate the offshore wind farm under the Federal licence, but it plans detailed studies for the 496-square-kilometre area (see map below) which will include environmental assessment of the impact on marine and bird life. If it is given a go-ahead, the 2000MW, 250 turbine wind farm is expected to be able to provide “full power” by 2027.[iv]
The project will also require around 25km of submarine cables and 70km of underground cables to link the wind farm to the existing grid in the Latrobe Valley[v].
Figure 1: Star of the South Project Licence Area
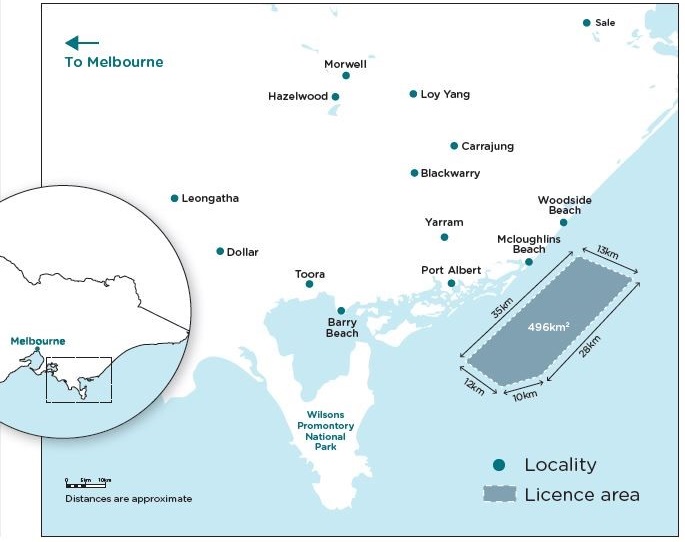
Source: OEPL
So how does Australia stack up for offshore wind farm potential? And is it likely to be economic given the infrastructure and logistical demands?
As part of its latest assessment of offshore wind farm development, the International Energy Agency (IEA) in tandem with the Imperial College London has released a series of geospatial maps to illustrate areas of potential. This work used the “ERA-5” reanalysis[vi], which provides four decades of historic global weather data. The potential of sites around the Australian coast at various depths and distance from shore are illustrated in figure 2 below.
The best locations, unsurprisingly, tend to be in shallower waters closer to shore with access to onshore infrastructure connections, although the IEA’s study does note that installations are now moving further from shore as the technology develops and into deeper waters where better quality wind resources are available.
Figure 2: Offshore wind technical potential map – Australia
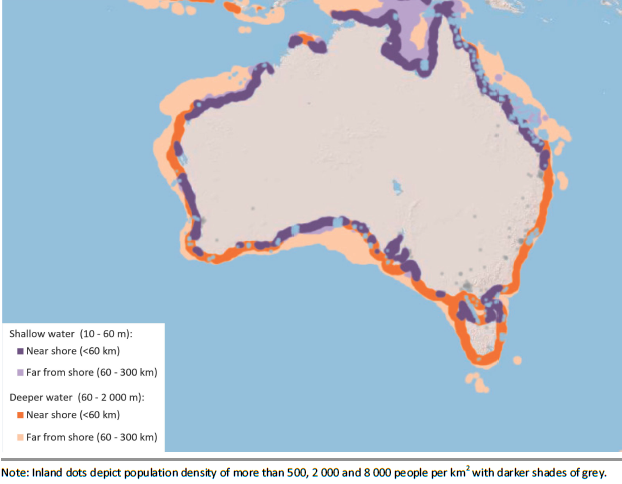
Source: IEA/Imperial College
While new to Australian waters, offshore wind farms have been expanding overseas with Europe continuing to lead the way.
Europe leads the way
Since 2010 offshore wind farms increased by 30 per cent (although off a low base). But over the next five years around 150 new projects are planned. In 2018, a total of 4.3GW of new offshore wind capacity was completed (figure 3). In 2010 there was 3GW of offshore wind in operation and by 2018, this installed capacity had expanded to 23GW.
Growth was initially fostered in European countries bordering the North Sea, where high quality wind resources and relatively shallow water had the right conditions in which to develop offshore wind technologies. Stable policies also helped and saw nearly 17GW of offshore wind capacity added in Europe between 2010 and 2018, according to the IEA.
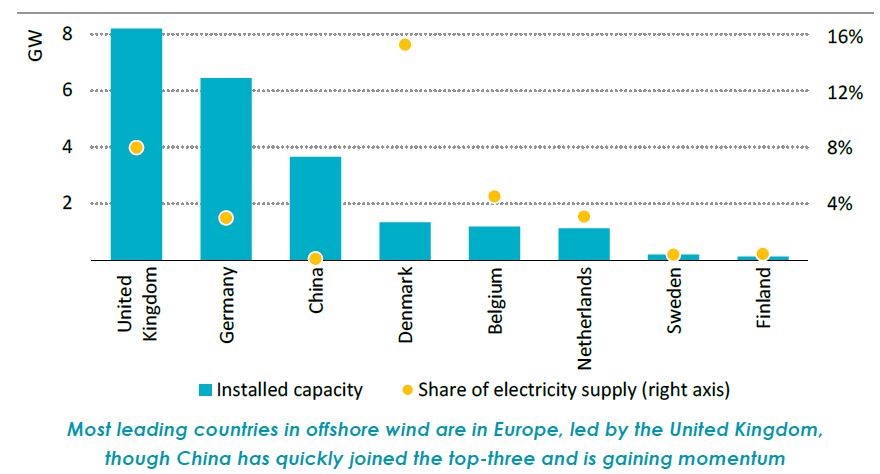
In 2018, more than 80 per cent of global installed offshore wind capacity was located in Europe, around 8GW, a third of the total, was in the UK and 6.5GW in Germany, with Denmark, Netherlands and Belgium providing a further 3.6GW between them. Last year Denmark received 15 per cent of its electricity from offshore wind farms, according to the IEA (See figure 4 below).
The UK, Germany, Belgium, Netherlands and Denmark together added 2.7GW of capacity in 2018 alone.
Figure 3: Annual offshore wind capacity additions by region, 2010-2018
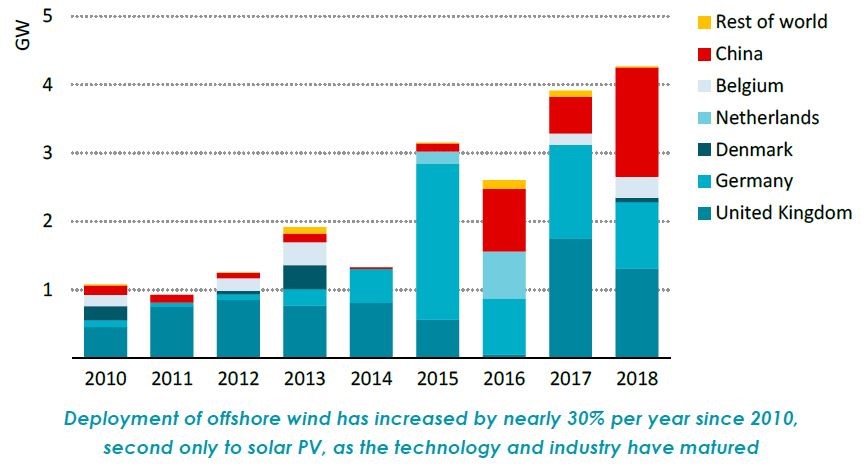 Source: IEA
China now also stands among the market leaders with 3.6GW of offshore wind capacity. In 2018, China added 1.6GW of offshore wind capacity (see figure 3), the most of any nation. This rapid growth has been driven by the Chinese Government’s 13th Five-Year Plan, which called for 5GW of offshore wind capacity to be completed by 2020 and for the establishment of supply chains to support its development.
The contribution of offshore wind generation to local electricity grids is shown in figure 4 below.
Figure 4: Offshore wind installed capacity and share of electricity supply by country, 2018
Falling costs, rising prospects
The IEA’s[vii] and Bloomberg New Energy Finance’s (BNEF)[viii] recent assessments of offshore wind and costs suggest that the uptake will accelerate as costs decrease in much the same way that we have seen increased adoption of solar and onshore wind as the technology costs fell.
The average upfront cost to build a 1000MW offshore wind project, including transmission, was estimated to be more than US$4 billion in 2018, but the IEA expects the cost to drop by more than 40 per cent over the next decade.
A significant reason for the drop is expected to be a 60 per cent fall in the costs of turbines, foundations and installation.
In contrast, transmission, which accounts for around 25 per cent of total offshore wind costs is expected to increase to about one half as new projects move further offshore, so innovation in transmission will become increasingly important.
BNEF reports that offshore wind has seen the fastest cost fall of all renewable sources. BNEF’s second-half 2019 global benchmark price of US$78/MWh – is down 32 per cent on the corresponding period in 2018 and is 12 per cent lower than the first half of the year[ix].
Offshore wind farms could also benefit from synergies with the offshore oil and gas industry. The IEA notes that with offshore energy operations sharing technologies and elements of their supply chains with the oil and gas sector, companies in that sector have been investing in offshore wind projects. The IEA estimates that about 40 per cent of the full lifetime costs of an offshore wind project, including construction and maintenance, have significant synergies with the offshore oil and gas sector.
Big Is better
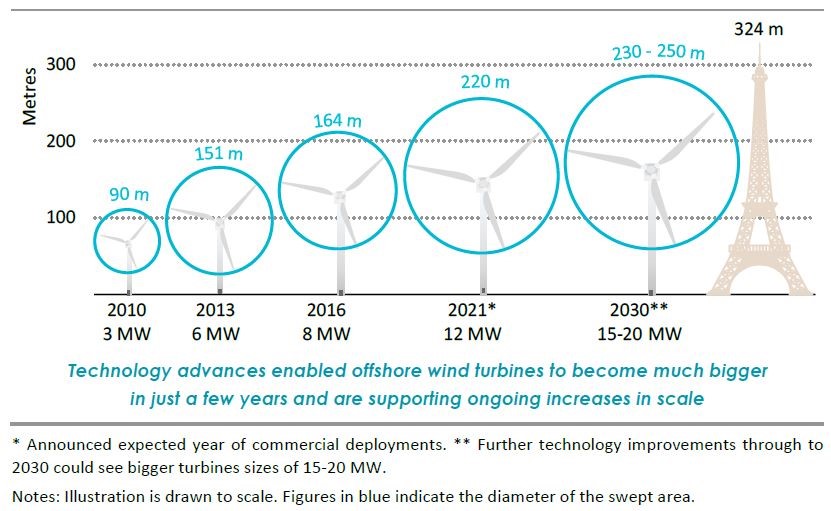
The size of wind turbines for offshore generation have continued to increase. The tip height of commercially available turbines increased from just over 100 metres in 2010 (for 3MW turbines) to more than 200 metres in 2016 (8MW), while the swept area increased by 230 per cent. This larger swept area allows for more wind to be captured per turbine. A 12MW turbine now under development is expected to reach a height of 260 metres, or more than three quarters the height of the Eiffel Tower (see figure 5).
Figure 5: Increasing scale of offshore wind turbines
 Source: IEA
Last month it was announced that General Electrics (GE) would be supplying its Haliade-X 12MW turbines, which have a 220 metre sweep, for a 3.6GW offshore wind farm being developed by SSE plc[x] and Equinor ASA off England’s east coast[xi].
The Dogger Bank wind farm won a power purchase contract from the UK Government in September that will support development of the project. The wind farm’s units will sell power for 39.65 pounds/MWh (more than $75/MWh) in 2012 prices, which is 31 per cent below the level in a similar auction two years ago. The wind farm is expected to start operating from as early as 2023.
According to the IEA the industry is now targeting even 15-20MW turbines by 2030. The increasing scale of the turbines is not only helping push down the cost of offshore wind farms but equally increasing their capacity factors.
Capacity factors
Capacity factors remain dependent on the quality of the wind speeds at individual sites and this may also mean some sites are not ideally suited to bigger turbines. But offshore wind does appear to deliver higher capacity factors than other renewables. In 2018, the average global capacity factor for offshore wind turbines was 33 per cent compared with 25 per cent for onshore wind turbines and 14 per cent for solar PV.
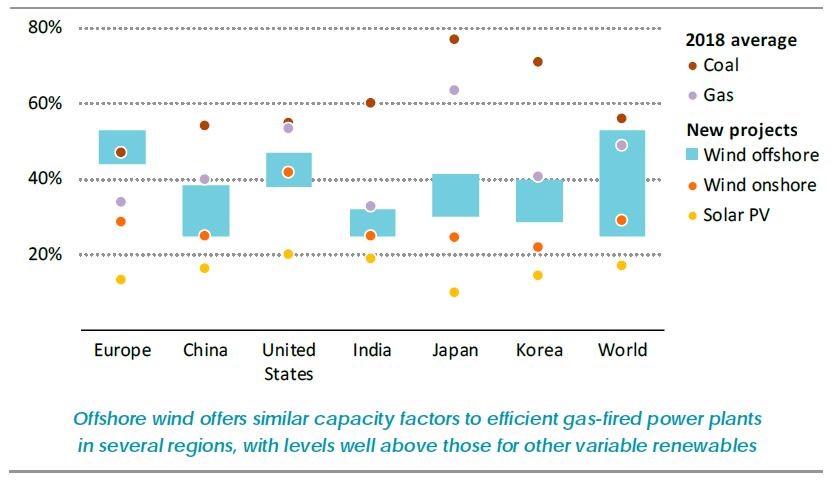
The IEA projects that newer offshore wind projects could have capacity factors of over 40 per cent in moderate wind conditions and over 50 per cent in high quality wind resource areas. Figure 6 highlights the capacity factors for different technologies in various regions.
Figure 6: Offshore Wind Farm Capacity Factors vs Other Technologies by Region
 Source: IEA
The world’s biggest developer of offshore wind farms, Orsted, struck a slight note of caution on capacity factors recently by flagging that it had overestimated the amount of time its turbines are generating electricity[xii].
Copenhagen-based Orsted A/S announced that offshore wind farms wouldn’t as much power as previously forecast. The adjustment could shave millions of dollars of revenue a year off each project, according to Bloomberg. Tests showed that the company’s current production forecasts underestimate the negative impact of the so-called blockage effect, when the wind slows as it approaches turbines. It also underestimated what is known as the wake effect, when wind speeds drop between wind parks.
The change will drop what’s called the lifetime load factor to 48 per cent, down from a range of 48-50 per cent, while a seemingly small percentage change, it does impact the financial modelling for its wind farms.
A striking shift
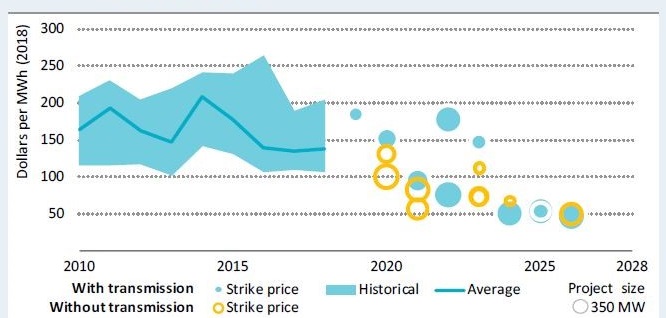
The falling costs of developing offshore wind farms is also showing up in the falling strike price for various offshore wind farm projects (see figure 7). The actual strike prices for various recent European projects is outlined in figure 8.
Figure 7: Historical LCoE and Strike Prices in recent European Auctions for Offshore Wind
 Source: IEA
Figure 8: Recent Strike Prices by Project
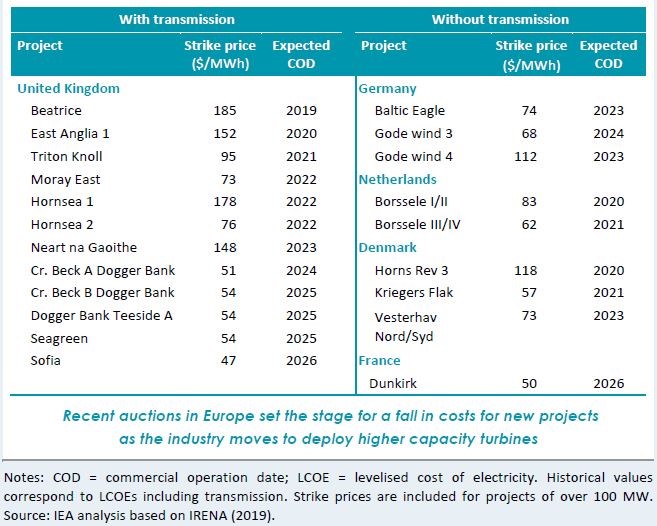 Source: IEA. Note all figures are in USD.
Where to next?
It could be some time before we now whether the Star of the South project proceeds to development, but according to the IEA’s overall assessment of offshore wind potential internationally (based on current and proposed policies) global capacity is set to increase 15-fold over the next two decades, turning it into a US$1trillion business.
It does, however, depend on government policies and industry strategies. The IEA notes that:
- Policy makers need to provide long-term visibility for supply chains to be efficient, and need to manage maritime planning and onshore grid development.
- Offshore wind can become one of the most competitive sources of electricity if market conditions are right and expected technology cost reductions actually materialise.
[i] Investigations Start On Australia’s First Offshore Wind Project, 21 November 2019.
[ii] http://www.starofthesouth.com.au/
[iii] “Testing begins for Australia’s first offshore wind farm in Australia”, The Age, 10 November 2019
[iv] ibid
[v] https://www.wsp.com/en-AU/projects/star-of-the-south; http://www.starofthesouth.com.au/
[vi] ERA5 is the latest climate reanalysis produced by the European Centre for Medium-Range Weather Forecasts, providing hourly data on many atmospheric, land-surface and sea-state parameters together with estimates of uncertainty.
[vii] Offshore Wind Outlook 2019, International Energy Agency
[viii] BNEF: Costs for offshore wind, battery storage have dropped sharply in past year, IEEFA 23 October 2019
[ix] ibid
[x] SSE was formed in 1998 following the merger of Scottish Hydro Electric and Southern Electric.
[xi] https://www.bloomberg.com/news/articles/2019-10-01/world-s-largest-wind-farm-set-to-run-on-ge-s-biggest-turbines
[xii] https://www.bloomberg.com/news/articles/2019-10-29/orsted-sinks-as-company-slashes-outlook-and-warns-of-job-cuts
Related Analysis
Wild Cards: Could these technologies advance the energy transition?
In December 2022, scientists at the National Ignition Facility achieved a landmark nuclear fusion result: a reaction that produced more energy than the laser pulse used to start it. It made headlines globally, but the caveats came quickly. Overall system energy use was still far higher, and commercial viability remains decades away. It was a real breakthrough, but also a reminder of how far the engineering still has to go. That gap between scientific progress and commercial reality is a defining feature of the energy transition today. While solar, wind, and batteries are scaling rapidly and doing most of the heavy lifting, the International Energy Agency estimates that nearly half of the emissions reductions needed for net zero will depend on technologies still at demonstration stage or earlier. This raises the key question: which “wild card” technologies could help close that gap?We take a look.
The ‘f’ word that’s critical to ensuring a successful global energy transition
You might not be aware but there’s a new ‘f’ word being floated in the energy industry. Ok, maybe it’s not that new, but it is becoming increasingly important as the world transitions to a low emissions energy system. That word is flexibility. The concept of flexibility came up time and time again at the recent International Electricity Summit held in in Sendai, Japan, which considered how the energy transition is being navigated globally. Read more
Nuclear Fusion Deals – Based on reality or a dream?
Last week, Italian energy company ENI announced a $1 billion (USD) purchase of electricity from U.S.-based Commonwealth Fusion Systems (CFS), described as the world’s leading commercial fusion energy company and backed by Bill Gates’ Breakthrough Energy Ventures. CFS plans to start building its Arc facility in 2027–28, targeting electricity supply to the grid in the early 2030s. Earlier this year, Google also signed a commercial agreement with CFS. These are considered the world’s first commercial fusion-power deals. While they offer optimism for fusion as a clean, abundant energy source, they also recall decades of “breakthrough” announcements that have yet to deliver practical, grid-ready power. The key question remains: how close is fusion to being not only proven, but scalable and commercially viable, and which projects worldwide are shaping its future?
Send an email with your question or comment, and include your name and a short message and we'll get back to you shortly.