

by Carol Tran
Switching on to gas competition
Competition in retail gas markets continues to evolve where different price deals allow customers to compare and choose the right plan to meet their consumption and energy management.
The number of customers switching their retailer is one of the measures used to examine the effectiveness of competition in each state. The competition has further intensified with new retail gas market entrants in New South Wales in 2015 (Dodo and Red Energy) as well as in Western Australia (Origin and AGL) in 2017.
The Australian Energy Market Operator’s (AEMO) latest September data on gas customers switching retailers, shows that the removal of gas price regulation in New South Wales since 1 July 2017, did not influence customer retail choices because customers had already switched from a regulated retail price to a market price[i].
Figure 1 shows that Victoria, where customers have an effective choice of retailer, continues to be the highest state for customers changing their gas provider with an average of 1.8 per cent of total gas connections per month and 21 per cent of gas customers transferring in the past 12 months. While South East Queensland, where retail competition is limited, had an average of 0.8 per cent of gas customers change their retailers each month since June 2016.
Figure 1: Monthly gas customer switching retailers
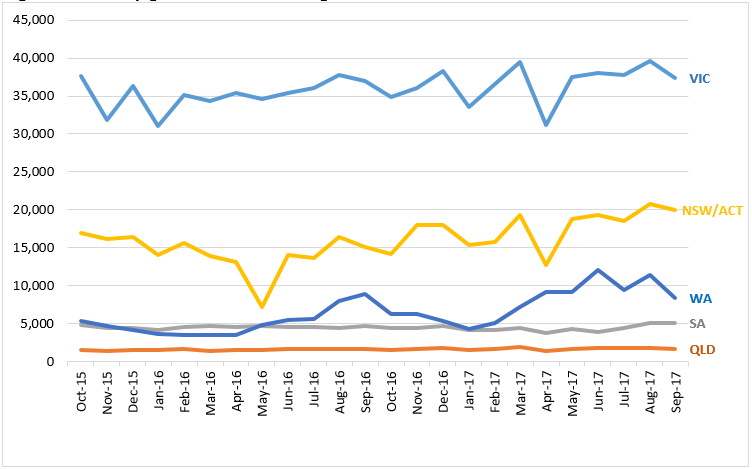
Source: AEMO’s Gas Monthly Retail Transfer Statistics, as of 30 September 2017
Table 1: Gas customer transfers over 12 months, 2015/16 and 2016/17
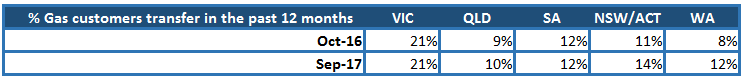
Source: AEMO’s Gas Monthly Retail Transfer Statistics, as of 30 September 2017
New South Wales
Prior to the gas price deregulation on 1 July 2017, gas retailers were required to offer regulated prices, which were agreed with the Independent Pricing and Regulatory Tribunal. This regulated price plan is not a cap and it does not prevent gas prices from increasing when the cost of gas rises. This also may not be the lowest price on offer in the market. When retail gas prices in NSW were deregulated, the only impact was on households and businesses who were on contracts with regulated gas prices.
Retail gas price deregulation does not change how customers look for a better deal since the retailers have already offered market prices to customers along with the regulated price offer. According to the NSW Government website, more than 80 per cent of households and small businesses had already switched from a regulated retail price to a market price before the retail gas price deregulation was announced[ii].
As can be seen in Figure 2, in NSW/ACT customer gas transfers show a monthly fluctuation between 0.8 and 1.3 per cent. Since energy retailers can set their own prices for gas, this means retailers are competing for customers, and customers can shop around more regularly and have greater control over their gas bill.
Figure 2: Monthly percentage gas customers switching retailers since FY 2016
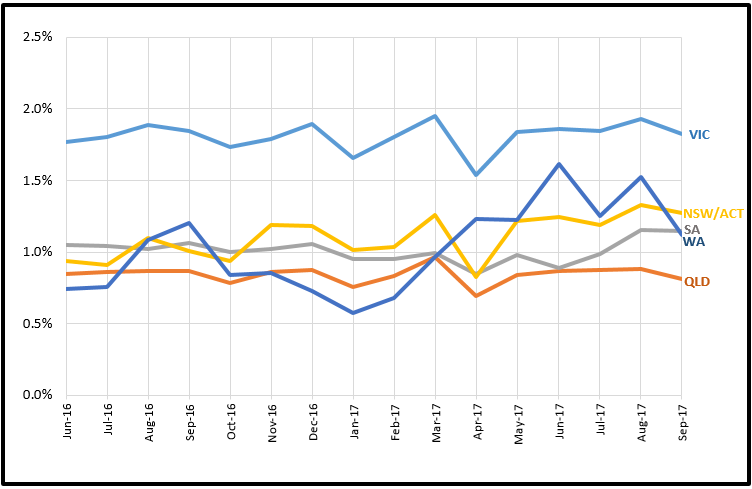
Source: Australian Energy Council’s analysis on AEMO’s monthly customer transfer and monthly new connections data, 2017
Queensland and South Australia
Queensland has the least gas customers opting for new retailers. The switching rate over the past 16 months among small gas customers remained steady in the state at around 0.9 per cent. Competition is narrowed where only two gas retailers are competing for customers due to the state’s relatively small size compared to other states. The market increased to 195,927 gas connections during financial year 2015-16, and new connections continue to register with the AEMO gas market system with an average of 619 connections per month.
SA has five gas retailers competing for around 440,000 customers. The gas switching rate in SA is generally higher compared to Queensland ranging between 0.9 and 1.2 per cent each month. An average of 564 of connections are registered with the AEMO gas system per month.
Victoria
Victoria not only has the greatest number of gas connections, it also has the highest percentage of customers switching retailers per month, fluctuating between 1.7 and 1.9 per cent. Across the market, strong signs of independent rivalry between retailers exist in Victoria’s retail gas market where 11 retailers are competing for around two million customers.
During 2016/17, the total percentage of gas customers opting for new retailers reached 21.4 per cent in Victoria, this is almost two times higher when compared to other states (9.9 per cent in QLD, 11.7 per cent in SA, 12.7 per cent in NSW/ACT and 11.6 per cent in WA).
Western Australia
Western Australia is the third largest state of gas connections, with a record of 734,345 of gas connections in 2015/16. The monthly switching rate in this state fluctuated highly and fell to 0.6 per cent in January 2017. Since then, the rate has been on a clear upward trend. As in Table 1, WA’s customer transfers had the largest increase compared to the same period of the previous year. As of September 2017, 12 percent of gas users have changed their retailer in the past 12 months, while a total of 8 per cent was recorded in the previous 12 months as of October 2016.
While WA’s gas market has been fully contestable since 2004[iii], Alinta Energy was the state’s only residential and small business gas retailer for many years. In 2013, Kleenheat entered the market. Over four years Kleenheat has increased its customer base, with recent media reports claiming the company now has up to a 25 per cent market share (180,000 customers)[iv]. The entrance of retailers Origin and AGL has intensified competition, and natural gas customers in the south west of the state now have twice as many retailers to choose from. In response to the announcement made by AGL at the end of 2016 that it would enter the WA gas market, the existing retailers increased their marketing and have offered a variety of new customer price specials and incentives.
Origin Energy also recently began offering gas deals to small-use customers, spurring even further choice for households and small businesses, with new customer incentives also announced today.
The increase in market players and retail competition has ultimately provided more choice to the customer, and may have resulted in the fluctuations and increase of customers switching their gas retailer.
Conclusion
This data shows that where there is competition, a diversity of retail offers, and where the difference between standing and market offers grow - the number of customers shopping around for a better deal is more substantial.
When there is a greater variation in retail prices and dispersion, as a function of retailers competing more intensely for customers, the market is more effective[vi]. This is because increasingly different retail tariff plans are offered to meet customer needs, and therefore retailers more effectively target different customer preferences.
Where competition is effective there will generally be low barriers to retailers entering, expanding in or exiting the market[vii]. This places competitive pressures on existing retailers to charge prices that reflect efficient costs and improve their offers.
[i] http://www.resourcesandenergy.nsw.gov.au/energy-consumers/energy-sources/gas/removal-of-gas-price-regulation-deregulation
[ii] ibid
[iii] https://www.claytonutz.com/knowledge/2016/september/opening-up-the-wa-residential-and-small-business-electricity-market-to-competition
[iv] https://www.energycouncil.com.au/media/10224/wa-discount-war.pdf
[v] https://www.energycouncil.com.au/media/10250/3-gas-win.pdf
[vi] 2017 AEMC Retail Energy Competition Review, July 2017.
[vii] 2017 AEMC Retail Energy Competition Review, July 2017.
Related Analysis
Beyond the “loyalty penalty”: unlocking CER value is the real pathway to a services market
The Australian Energy Market Commission pricing review has sparked debate about fairness and competition, with the AEC cautioning against treating price differentials as the core problem. Recent evidence from the ACCC suggests competition and recent reforms are improving customer outcomes with the AEC arguing that a true shift to a services-based market will depend on unlocking and fairly sharing CER value, not weakening the competitive dynamics that drive innovation. We outline our position on the review. Read more.
A New Year: New regulated offer; new records but some old challenges
A new year has brought major developments across Australia’s energy markets, with new regulatory interventions alongside record-breaking renewable generation. The Federal Government’s Solar Sharer Offer marks a significant shift in retail market design, while the wholesale market delivered historic renewable output and much lower prices, driven largely by strong wind and growing battery capacity. We take a look at what these changes mean for customers, retailers and the reliability of the power system, and where old challenges continue to resurface.
2025 Another Year Full of Energy (Developments)
2025 has been another year in which energy-related issues have been front and centre. It ended with a flurry of announcements and releases, including a new Solar Sharer tariff proposed by the Federal Government and the release of the 2026 Integrated System Plan (ISP) draft. Below we highlight some of the more notable developments over the past 12 months.
Send an email with your question or comment, and include your name and a short message and we'll get back to you shortly.