
by AEC
Sandbag Climate Campaign Outlook
On January 19, Sandbag Climate Campaign released its report on the European energy market for 2015. The report focuses on the change in generation mix, its impact on emissions across Europe for the 2014-15 financial year and the factors which have led to these changes.
Renewable energy generation increased by 87 TWh in 2015. Renewables now account for 29 per cent of total electricity demand, increasing from 17 per cent in 2008. Its increasing share of total demand has been helped by falling electricity demand over the same period. Figure 1 shows the annual change in generation mix for 2015.
Figure 1: Change in EU Generation 2015 vs 2014

Overall, total generation across Europe increased by 37 TWh, with renewable generation accounting for the increase. Total fossil fuel generation remained relatively unchanged for the year. Hydro and nuclear, however, fell with lower than usual hydro dam levels and issues with some base load nuclear generators which are expected to be fixed for the 2016 financial year.
The generation mix across Europe varies across countries with different policies having a significant impact on the changing mix. Below is a brief summary of how each country contributed to the rise and fall of different fuel types.
Coal
The decrease in coal generation was driven by the collapse of coal generation in the UK where the carbon price doubled to £18/tonne ($36.96/tonne)[i] in the 2014-15 financial year. However, this was offset by increased coal generation in the Netherlands, Spain and Portugal. The Netherlands increased its coal generation by 11 TWh. The increase is due to a temporary surplus of coal-fired generation as 3.2 GW of new coal plan came online in 2015, while older coal plants are set to retire in 2017. In Spain and Portugal lower hydro generation led to large increases in coal generation.
Gas
Gas fired generation decreased in Germany, the Netherlands and the UK. Germany peaking plants are running at all-time low capacity factors, continuing the decline of gas fired generation in Germany. The UK decreased gas fired generation due to increased renewable generation and following the increase in coal fired generation capacity, the Netherlands were forced to reduce gas fired generation to accommodate the increased coal usage. Spain and Portugal increased their gas fired generation to counter the effects of low rainfall and lower than usual output from hydro power stations, which offset the reduction to an extent.
Renewables
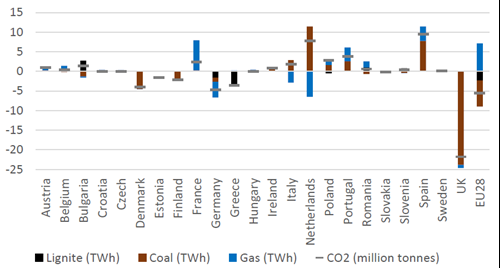
The increase in renewable generation was primarily driven by three countries, Germany, Italy and the UK. Smaller increases occurred in Sweden and France. In some countries such as Spain and the Netherlands, renewable energy actually dropped when compared to the previous year. Figures 2 and 3 show the annual changes in renewable and fossil fuel generation respectively.
Figure 2: Change in Renewable Generation by Country 2015 versus 2014
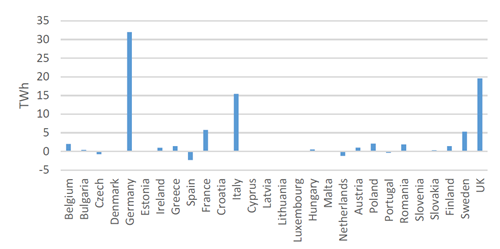
Figure 3: Change in Generation and Emissions 2015 versus 2014
Emissions
Emissions decreased 0.5 per cent in 2015 following a 7.5 per cent decrease in 2014. The report suggests emissions will begin to fall rapidly in 2016. In addition to increasing renewable generation capacity and declining demand, a few short term changes to local energy markets are expected to continue the decrease of emissions across Europe. Denmark will close 2.7 GW of coal plants between 2015 and 2017; the UK will close 5.8 GW of coal plants in 2016, while the rest of the EU will also close 4.3 GW of coal plants in 2016 alone.
Nuclear is expected to play a larger part of Europe’s energy mix in 2016 as nuclear plants in several countries encountered issues in 2015 and these are anticipated to be resolved in 2016. Belgium is also bringing 2.4 GW of nuclear plant back online in December 2015 to reduce their reliance on fossil fuels.
The Spanish-French interconnector went live in November 2015 and will reduce Spanish coal output. Hydro levels are also expected to return to normal levels which will reduce reliance on fossil fuels.
Conclusion
The Sandbag consultancy report is a brief overview of changes which occurred in 2015. The effects of policy, weather and interconnectors all play a major factor in individual countries as highlighted above. Australian energy policy is often compared to different European nations and their own ambitious targets. When making comparisons, it is worth noting the complexity of the energy system in Europe, how these countries energy mixes differ substantially and the interconnection between their respective energy markets.
[i] Exchange rate at 12/2/2016 was $2.05 AUD. http://www.xe.com/currencyconverter/convert/?From=GBP&To=AUD
Related Analysis
The ‘f’ word that’s critical to ensuring a successful global energy transition
You might not be aware but there’s a new ‘f’ word being floated in the energy industry. Ok, maybe it’s not that new, but it is becoming increasingly important as the world transitions to a low emissions energy system. That word is flexibility. The concept of flexibility came up time and time again at the recent International Electricity Summit held in in Sendai, Japan, which considered how the energy transition is being navigated globally. Read more
Nuclear Fusion Deals – Based on reality or a dream?
Last week, Italian energy company ENI announced a $1 billion (USD) purchase of electricity from U.S.-based Commonwealth Fusion Systems (CFS), described as the world’s leading commercial fusion energy company and backed by Bill Gates’ Breakthrough Energy Ventures. CFS plans to start building its Arc facility in 2027–28, targeting electricity supply to the grid in the early 2030s. Earlier this year, Google also signed a commercial agreement with CFS. These are considered the world’s first commercial fusion-power deals. While they offer optimism for fusion as a clean, abundant energy source, they also recall decades of “breakthrough” announcements that have yet to deliver practical, grid-ready power. The key question remains: how close is fusion to being not only proven, but scalable and commercially viable, and which projects worldwide are shaping its future?
Community Power Network Trial: Potential risks and market impact
Australia leads the world in rooftop solar, yet renters, apartment dwellers and low-income households remain excluded from many of the benefits. Ausgrid’s proposed Community Power Network trial seeks to address this gap by installing and operating shared solar and batteries, with returns redistributed to local customers. While the model could broaden access, it also challenges the long-standing separation between monopoly networks and contestable markets, raising questions about precedent, competitive neutrality, cross-subsidies, and the potential for market distortion. We take a look at the trial’s design, its domestic and international precedents, associated risks and considerations, and the broader implications for the energy market.
Send an email with your question or comment, and include your name and a short message and we'll get back to you shortly.