
by Allan O'Neil for AEC
SA's renewables "challenge": The role of demand management, batteries & storage
The first part of this analysis drew on recent South Australian electricity data to examine, via this real-world “experiment”, some of the impacts arising from the transition to higher penetration of large and small scale renewables, particularly the changing requirements on dispatchable generation and other resources as the residual demand curve evolves.
The challenges identified include the diminishing physical and economic headroom for traditional baseload generation, cost-effectively meeting “needle peaks” in residual demand, and dealing with periods of negative residual demand, when output from non-dispatchable renewables exceeds consumption.
This concluding article assesses the potential role of non-traditional dispatchable resources such as demand management, batteries, and other storage options in addressing these challenges.
The “needle peak” challenge arises because as non-dispatchable renewables are added to a system they reduce average residual demand but make smaller and smaller contributions to reducing residual demand peaks, meaning that an increasing proportion of the dispatchable resources serving the system are utilised only for very short periods of a year as shown in the figure below reproduced from last week’s article:
Figure 1: Energy associated with top and bottom 50% of residual demand: SA 2016-17
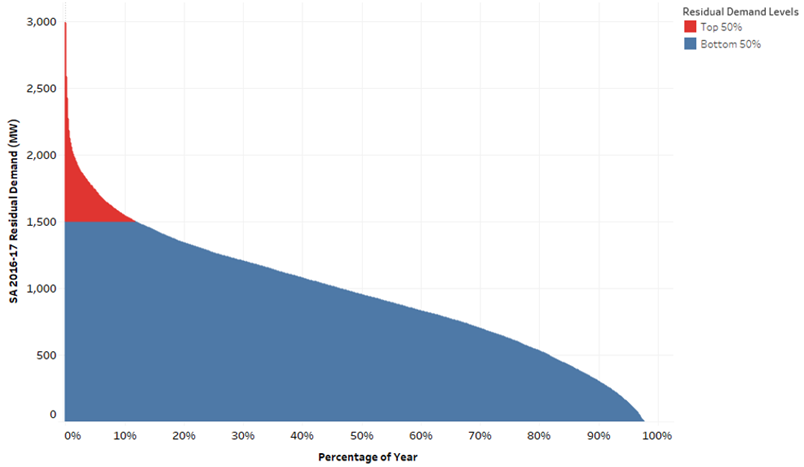
Source: Analysis of AEMO data for 2016-17
The strong attraction of demand management (including demand shifting) is the potential to reduce the maximum level of residual demand without large capital investment in rarely-utilised fixed capacity. Results from AEMO’s Reliability and Emergency Reserve Trader tender and joint Demand Side Response initiative with ARENA[1] will be important indicators of the scope for this approach. Energy storage on the other hand does entail significant capital investment (e.g. in batteries & inverters whether large scale like the Neoen / Tesla Jamestown facility[2], or small scale residential systems; or in pumped hydro schemes) but can play multiple system and market roles[3] in addition to meeting peak residual demands, and can address negative residual demand by storing surplus energy produced at times of high renewables output.
Storage options include those associated with dispatchable renewables which comprise a renewable generation source coupled with on-site storage, allowing for control over when generated energy is dispatched to the grid. Good examples are various proposals to build utility scale photovoltaic (PV) plants with integrated battery storage, or the Aurora 150 MW solar tower and molten salt storage facility proposed for Port Augusta under the South Australian Government’s Energy Plan[4]. The analysis in this article is applicable to these integrated forms of storage as well as their stand-alone equivalents.
The relative economics of these options compared to traditional dispatchable supply sources is evolving rapidly and a subject beyond this article’s scope, but data from South Australia does enable some illustrative analysis of various storage technologies’ impact on the shape of the residual demand curve and therefore some indication of their effectiveness in meeting the “needle-peaking problem” and storage of surplus energy production.
Storage Characteristics – Impacts on Daily Demand
An important parameter for any battery or storage scheme is its energy storage capability, relative to maximum output. This can be expressed as number of hours of storage, by simply dividing maximum energy stored (in MWh) by maximum output (in MW). For batteries, this will typically be just a few hours – e.g. the Neoen / Tesla facility is understood to comprise 129 MWh storage and maximum output of 100 MW, or 1.29 hours storage. For a pumped hydro scheme, storage capability may run into days – possibly longer in the case of a very large scale proposal like Snowy 2.0[5].
To understand why this is critical, we can look at an example case comprising a single day and analyse the role that batteries with different amounts of energy storage could play in reducing peak levels of residual demand.
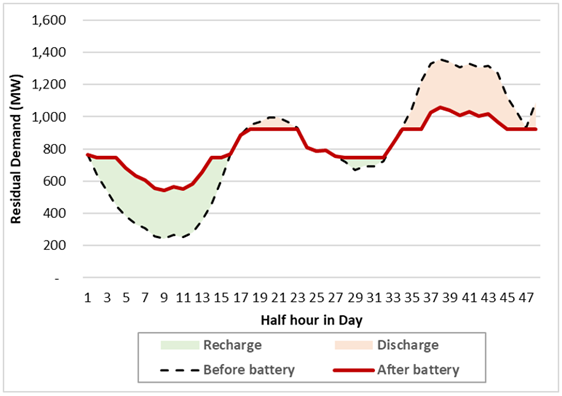
Figure 2 illustrates a simple battery storage model which “clips” the highest residual demands in a day – to the limit of the battery’s output in MW and / or overall storage capacity in MWh – and fully recharges that capacity in the lowest demand periods of the day, limiting the recharge rate to equal the maximum discharge rate. Parameters chosen in this example are a 300 MW battery with a very large six hours (1,800 MWh) of storage capability. The dotted black line shows residual demand without battery operation, and the solid red line shows the post-battery residual demand. The shaded areas between these lines show battery discharge – reducing residual demand – in pink, and battery recharge, which increases residual demand, in green. The impact of the battery in flattening out residual demand is clear:
Figure 2: Modelled Effect of 300 MW / 1,800 MWh Battery on Daily Residual Demand
But the battery’s ability to achieve this flattening depends not just on its maximum output – which obviously sets the maximum reduction in any half hour – but also its energy storage capability. Figure 3 shows the greatest flattening of the same residual demand shape that can be achieved by a 300 MW battery with only 1.5 hours’ storage:
Figure 3: Modelled Effect of 300 MW / 450 MWh Battery on Daily Residual Demand
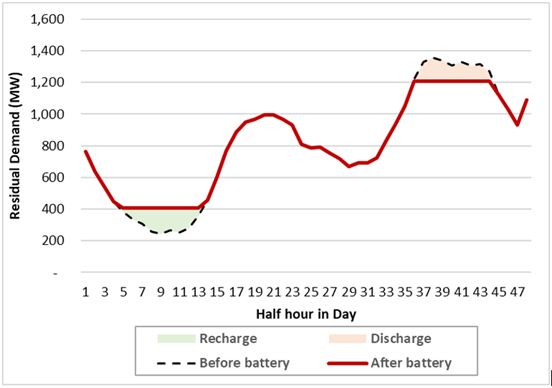
The battery’s ability to clip the evening maximum demand is now limited not by its 300 MW output but by its stored energy. In the example there are nine half hours of consecutive residual demands exceeding 1200 MW. While the battery could reduce any one or two of these by more than the ~100-150 MW shown, doing so would rapidly exhaust its stored energy and ability to reduce demands in neighbouring half hours, and therefore not reduce the overall demand peak.
Impacts on the Residual Demand Duration Curve
Clearly battery storage capability matters, not just maximum output. But when we look at the annual pattern of residual demand, even batteries with relatively high storage capability don’t change the overall picture greatly. Certainly such batteries can flatten out demand across any given day as shown above, but they would have a more limited effect on the overall residual demand curve:
Figure 4: Modelled Effect of 300 MW / 1,800 MWh Battery on SA 2016-17 Residual Demand Duration Curve (Inset: Top 1% of hours)
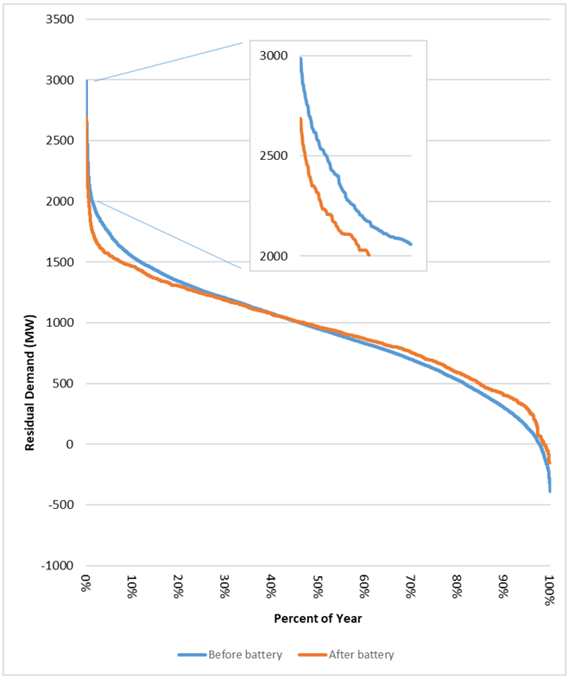
Figure 4 shows that a large battery would reduce peak residual demand, and limit negative residual demands, but the overall shape of the post-battery residual demand curve remains very steep. So while batteries with multiple hours of storage could reduce absolute peak demands on a megawatt for megawatt basis, by themselves they would not remove the need for other dispatchable technologies to meet the large remaining variation in residual demand.
Longer Duration Storage and the Challenge of 100 per cent Renewables
This takes us into the territory of technologies less limited by energy storage and production capability - those able to address multiple days of low renewables output and extended high residual demand. Conventional dispatchable generation such as liquid and gas-fired peaking or reserve capacity is effectively the default option here. What about long-duration storage options such as pumped hydro?
Let’s assume that sufficient solar and wind generation were installed in South Australia to produce annual energy equal to total consumption. This may not be a physically realistic scenario, requiring total solar and wind capacity approaching 5,000 MW, but it provides some sense of the energy storage capability required to deal with the mismatch between time of consumption and time of energy production with very high renewable penetration. The residual demand curve before any storage deployment in this scenario, modelled as a 150 per cent increase in rooftop PV and windfarm capacity, is shown below:
Figure 5: SA Residual Demand Curve - Hypothetical 100% Renewables Scenario
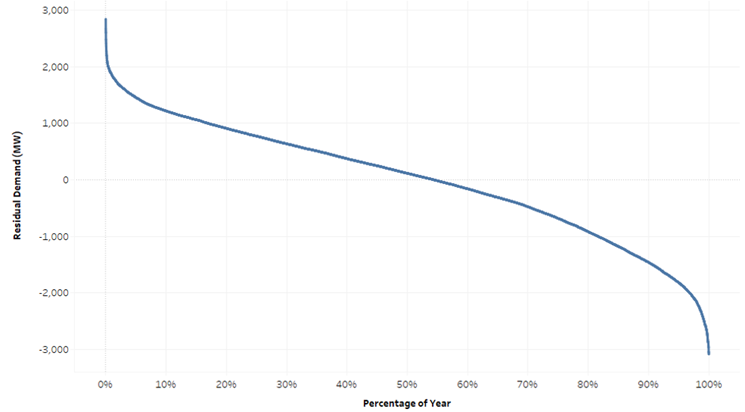
Source: Modelling based on AEMO 2016-17 data
Since the key purpose of this scenario is to illustrate the challenges of increasing renewables penetration in the NEM generally, South Australia’s interconnectors to Victoria are ignored in this analysis. The storage challenge is to absorb the excess renewable production associated with negative residual demands and release this energy when needed to meet positive residual demands. Roughly 3,000 MW of dispatchable storage capacity – maximum storage and production rates in MW – would be required (broadly equal to existing dispatchable generation in South Australia). But how many hours or days of energy storage capability would be required to absorb prolonged periods of renewables output exceeding consumption, or to maintain supply when renewables output is at sustained low levels? The following charts summarise the challenge:
Figure 6: 100% Renewables and Storage Scenario based on SA 2016-17 data – Daily Averages
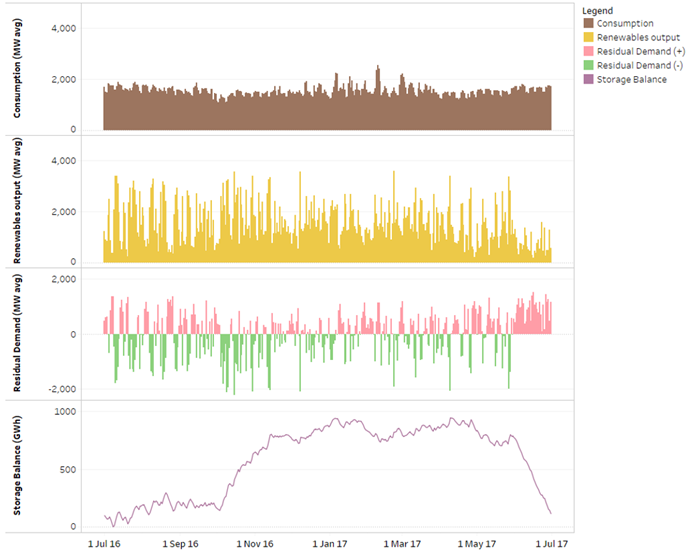
Source: Modelling applied to AEMO data for 2016-17
The storage balance line in the bottom panel – which is essentially the accumulated difference between renewables production and consumption – indicates that nearly 1,000 GWh of energy storage capability could be required in this scenario[6]. Note particularly the sustained increase in balance in the October – December period (corresponding to frequent negative residual demand, i.e. renewables production exceeding consumption), and the rapid drawdown in June (a period of prolonged low renewables output in 2016-17 and therefore positive residual demand).
1,000 GWh corresponds to around 330 hours or 14 days of storage (relative to 3,000 MW maximum output). The Neoen / Tesla battery under construction in South Australia has just 129 MWh or 1.29 hours’ storage, so scaling this up to 330 hours just for this 100 MW facility, requiring 33,000 MWh or 33 GWh of storage capability, would mean increasing its battery capacity by a factor of 256, and then multiplying this by a further factor of 30 to deliver 3,000 MW with 330 hours storage. Currently, large scale battery storage costs are estimated at around $500 per kWh[7], or $500 million per GWh, so at today’s prices 1,000 GWh of battery storage might cost around $500 billion[8]! Even the very large scale Snowy 2.0 pumped hydro proposal envisages only 350 GWh storage, serving much larger markets than just South Australia. So while the amount of storage shown above is purely an order of magnitude estimate, it would seem to be an impractically large figure for battery-based facilities and extremely challenging even for pumped hydro schemes to support 100 per cent renewable generation.
Conclusions
- As renewables penetration increases, the role of dispatchable resources – whether conventional, demand-side, or newer technologies like batteries – will remain critical to balancing the impact of non-dispatchable consumption and renewables;
- The nature of the dispatchable resources needed will change. The role for traditional continuous high output baseload technologies will diminish;
- Battery storage will play a role in “demand clipping” but seems very unlikely by itself to provide the lion’s share of the dispatchable balancing resources required; and,
- In a very high renewables penetration scenario, the energy storage capability required to balance prolonged periods of mismatch between consumption and renewable production appears to be very substantial unless there are very large shifts in the timing and controllability of end use consumption. Note that this conclusion applies equally to stand-alone storage facilities or to storage “bundled” with non-dispatchable solar or wind generation sources.
It’s very likely that economic analysis would indicate an ongoing role for conventional dispatchable reserve generation – probably gas or liquid fuelled – as more cost effective than relying completely on storage to balance high penetration renewables generation.
By Allan O'Neil, Energy Markets Consultant
[1] More detail in the recently released Electricity Statement of Opportunities: http://www.aemo.com.au/Electricity/National-Electricity-Market-NEM/Planning-and-forecasting/NEM-Electricity-Statement-of-Opportunities
[2] http://ourenergyplan.sa.gov.au/battery.html
[3] Some of these roles include frequency control services, price arbitrage, and network management.
[4] http://ourenergyplan.sa.gov.au/new-generation.html
[5] http://www.snowyhydro.com.au/our-scheme/snowy20/snowy-2-0-faqs/
[6] For simplicity this scenario and modelling ignore “round-trip” energy losses into and out of storage. In practice such losses would increase the capacity of renewables and storage capability required to support 100% renewables penetration.
[7] Modelling by Jacobs Group for the Finkel review estimated large scale battery storage costs at $533/kWh – see http://www.environment.gov.au/system/files/resources/1d6b0464-6162-4223-ac08-3395a6b1c7fa/files/emissions-mitigation-policies.pdf at p37
[8] This is purely an order-of-magnitude estimate – large scale battery costs are expected to fall and it is certainly not being suggested that building such extensive battery storage would be the most economic way to support a 100% renewables scenario.
Related Analysis
Certificate schemes – good for governments, but what about customers?
Retailer certificate schemes have been growing in popularity in recent years as a policy mechanism to help deliver the energy transition. The report puts forward some recommendations on how to improve the efficiency of these schemes. It also includes a deeper dive into the Victorian Energy Upgrades program and South Australian Retailer Energy Productivity Scheme.
Beyond the Rebate: Battery Policy, VPPs, and Household Returns
A re-elected Labor Government’s promise to cut home battery costs by 30 per cent through the Small-scale Renewable Energy Scheme (SRES) has sparked interest—and raised questions. While the move may accelerate battery uptake among solar households, critics warn it could deepen inequities by leaving renters and vulnerable customers behind. More importantly greater value will be realised if the storage capacity is also coordinated through mechanisms like Virtual Power Plants (VPPs). We take a look at the benefits of VPPs.
The return of Trump: What does it mean for Australia’s 2035 target?
Donald Trump’s decisive election win has given him a mandate to enact sweeping policy changes, including in the energy sector, potentially altering the US’s energy landscape. His proposals, which include halting offshore wind projects, withdrawing the US from the Paris Climate Agreement and dismantling the Inflation Reduction Act (IRA), could have a knock-on effect across the globe, as countries try to navigate a path towards net zero. So, what are his policies, and what do they mean for Australia’s own emission reduction targets? We take a look.
Send an email with your question or comment, and include your name and a short message and we'll get back to you shortly.