
by Allan O'Neil & Carl Kitchen
SA’s big battery: A look at its performance
South Australia’s “big” battery, the 100MW 130MWh Hornsdale Power Reserve, has attracted significant attention as one of the largest installed globally to date. It offers useful insights on the capabilities of the technology to support the grid. Independent energy consultant Allan O’Neil has looked at the contribution of the battery to grid security when a large generating unit tripped[i], and how the system overall responded to this event.
Elsewhere, the Australian Energy Market Operator has released a paper on the initial operation of the SA battery system that considers how, what is effectively a demonstration project, has performed. It also flags that current Frequency Control Ancillary Services (FCAS) market arrangements could also be modified to specifically recognise the rapid and accurate response capabilities of batteries.
Below we take a look at what they found.
Allan O’Neil’s consideration of the contribution of the Hornsdale Power Reserve (HPR) followed “a bit of hype” about the “Big Battery’s” performance following the trip of a large coal-fired unit in Victoria early on the morning of 14 December.
Allan O'Neil Assesses Battery Response to Unit Trip
An article appeared on the Reneweconomy energy news site, which might have been read as crediting the “millisecond response” of the battery for saving the grid from some sort of catastrophe, and contrasting this with the slower response of “the generator contracted at that time to provide FCAS, the Gladstone coal generator in Queensland”.
At any one instant there are always many generators enabled in the National Electricity Market (NEM) to provide FCAS – services which come in eight different flavours, from second-to-second frequency regulation, through to delayed-reaction contingency response over timeframes of up to five minutes. So focusing on what Gladstone did or didn’t do clearly couldn’t tell the whole story. And whatever the speed of HPR’s response, being a much smaller facility (100 MW) than the tripped Loy Yang A unit 3 (560 MW) meant it was never going to be able to stabilise system frequency all by itself. That requires replacing essentially all the tripped unit’s lost power output with increased output from other sources.
A chart in the original Reneweconomy article showed the timing of events with the Loy Yang A unit’s output falling away, and a sudden injection of power from the battery (HPR):
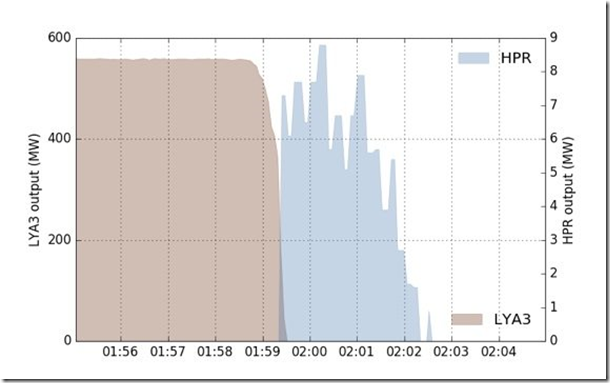
Source: Reneweconomy, 19 Dec 2017
Looks impressive, but a closer glance at the scaling of the chart shows that the maximum injection of power from HPR was less than one sixtieth of what was lost when Loy Yang A3 tripped. If we use a common scale for both facilities then the picture is a little different as shown in figure 1:
Figure 1
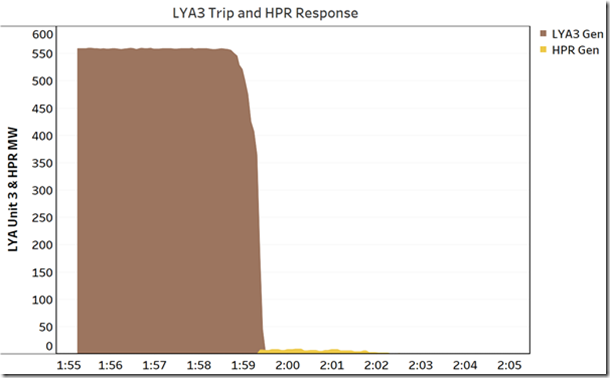
Source: AEMO Causer-Pays SCADA dataset
But for at least some Reneweconomy readers – see the voluminous comments thread under the article – this was unimportant detail and it was the speed of that response that must have been decisive. After all, according to the article, “by the time that the contracted Gladstone coal unit had gotten out of bed and put its socks on so it can inject more into the grid – it is paid to respond in six seconds – the fall in frequency had already been arrested and was being reversed”. Now, speed of response is a factor in response to contingencies[ii] but it’s far from being the only one.
To be fair, a subsequent update to the article makes it clear that there was never an intention to suggest that the response of the battery “averted a blackout”, and that the author’s point was to show “what Tesla could do”.
But to see all this in better context, the point of this analysis is to show what the system as a whole does when a large generating unit trips, covering the response of a broad set of generators.
A quirk of the FCAS markets means that AEMO publishes operational data from its Energy Management System which captures SCADA data every four seconds on generator outputs, system frequency, and other arcana, to support cost allocation of certain FCAS services under the “Causer-Pays” principles of the National Electricity Rules. For very good reasons commercial electricity market viewer / analysis products don’t deal with this level of detail, but it’s the best available public source to understand what happens in response to a large unit trip. It’s this sub-five minute world that FCAS is concerned with.
For a start we can look at what NEM generation levels and system frequency were doing for the five minutes up to and just after the Loy Yang A3 trip which is shown in figure 2.
Figure 2
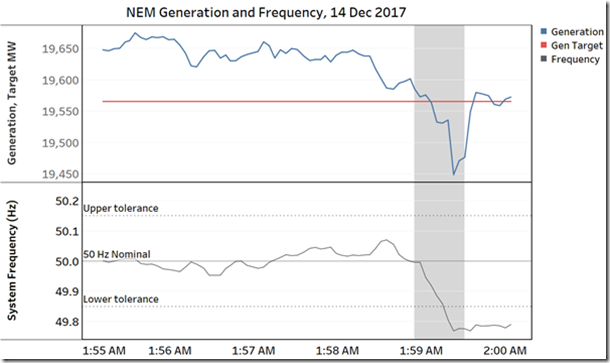
Source: AEMO Causer-Pays SCADA dataset
Here we are looking at a single five-minute dispatch interval. The blue generation line is essentially total scheduled generation in the NEM, and the red Target line is what AEMO has instructed that generation to produce by the end of the interval. The fact that generation exceeds the target level by around 80-100 MW for most of the interval could reflect a number of factors, for example scheduled demand being higher than forecast by AEMO (requiring some generators to be dispatched upwards in the raise regulation FCAS market, to maintain system frequency at 50 Hz).
The frequency line shows system frequency which is nominally 50 Hz, with a normal tolerance range of +/- 0.15 Hz, indicated by the upper and lower reference lines. The grey shaded time interval covers just over 30 seconds (from 1:58:55 AM to 1:59:31 AM) during which the Loy Yang A unit’s output fell from nearly 550 MW to zero as the generator went offline.
You can clearly see the effect on system frequency – as input to the grid drops, its frequency begins to slow down, just like a vehicle travelling steadily up a hill would decelerate if its engine power fell. In fact power system frequency is the direct analogue of speed, because it reflects the rate of rotation of all the spinning synchronous generators and motors connected to the system.
You can also see a notch in the overall generation level corresponding to the falloff of the Loy Yang A unit, but interestingly this is nothing like as large as the 550 MW loss of generation from that unit, and quickly bounces back to close to where it was – so what’s going on? And finally as generation bounces back, system frequency stabilises although it still sits below the lower tolerance band.
We know the tripped Loy Yang A unit didn’t suddenly come back online, so other generators must have made up the deficiency – which ones? Figure 3 covering 30 seconds either side of the trip, is a bit busy, but it highlights the fact that many generators across the NEM responded, prompted by the falling system frequency. This is a great example of FCAS in action.
Figure 3
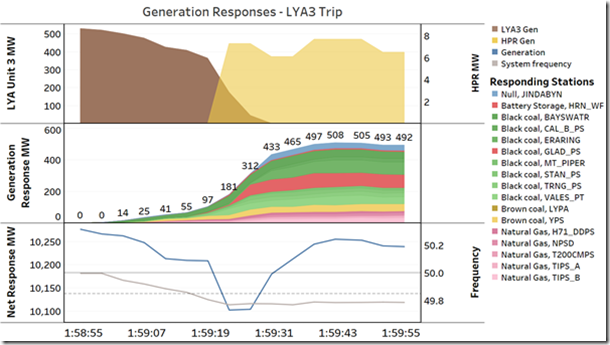
Source: AEMO Causer-Pays SCADA dataset
The top panel is essentially a closeup of the same Reneweconomy chart that prompted this analysis, showing the rundown of the Loy Yang A unit (LH axis) and the response of the Tesla battery / Hornsdale Power Reserve (RH axis). The middle panel shows the increase in output from the whole subset of generators around the NEM that materially responded to the event (plenty didn’t). To be clear, except for the battery and the Jindabyne hydro unit in blue, these generators were already online and producing before the trip – they simply increased their output, using what’s known as “spinning reserve”. In terms of FCAS markets, this response would be primarily the fast raise (6 second) and slow raise (60 second) contingency services enabled by AEMO. For emphasis, the responses from the SA battery and also from Gladstone in Queensland is highlighted in red. It’s very clear that they were only a small part of the overall story, nor was either the first to respond to the event. In fact most of the response came from old-fashioned coal-fired stations. That’s not at all surprising, because in this overnight timeframe with low demand it’s predominantly coal generation that’s online, and contrary to what you might expect from reading elsewhere, during low to moderate demand periods online coal fired generation can usually vary its output fast enough, in aggregate, to respond perfectly adequately to this kind of event.
Finally a note on chronology – it’s curious that system frequency appears to start falling well before the major changes in generation, by about 12-20 seconds, and then to stabilise before the bulk of the generation response arrives. While the data used in these charts is all timestamped according to AEMO’s public files, I strongly suspect there are some measurement lags or timing offsets present in this raw operational data, and it’s likely that in real time the inflection points in frequency and generation levels respectively line up much more closely than shown above.
AEMO’s initial assessment
The SA battery is effectively serving as a demonstration project for batteries within the system. While its relative capacity is small, within the scope of what it is designed to do it has proven to be very effective, according to AEMO’s initial assessment.
AEMO found that the regulation FCAS that the HPR provided is rapid and precise compared to conventional synchronous generation unit – see figures 4 and 5.
Figure 4: Accuracy and speed of regulation FCAS response - large conventional steam turbine
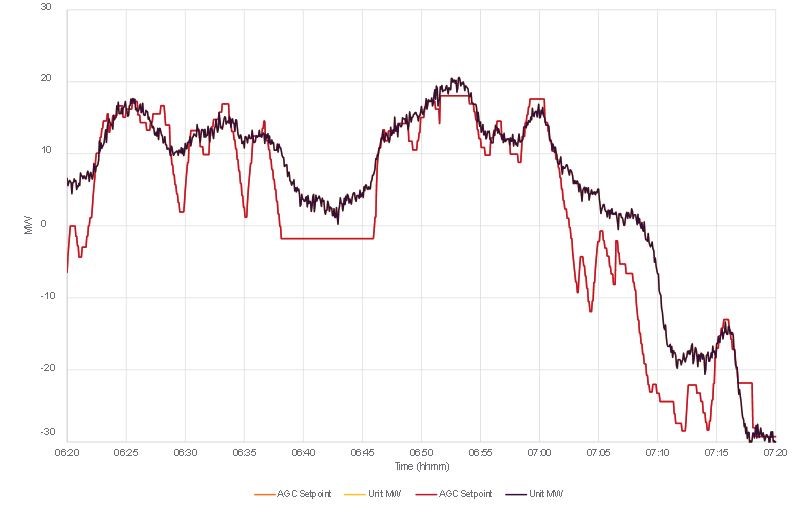
Source: AEMO
Figure 5: Accuracy and speed of regulation FCAS response - Hornsdale Power Reserve
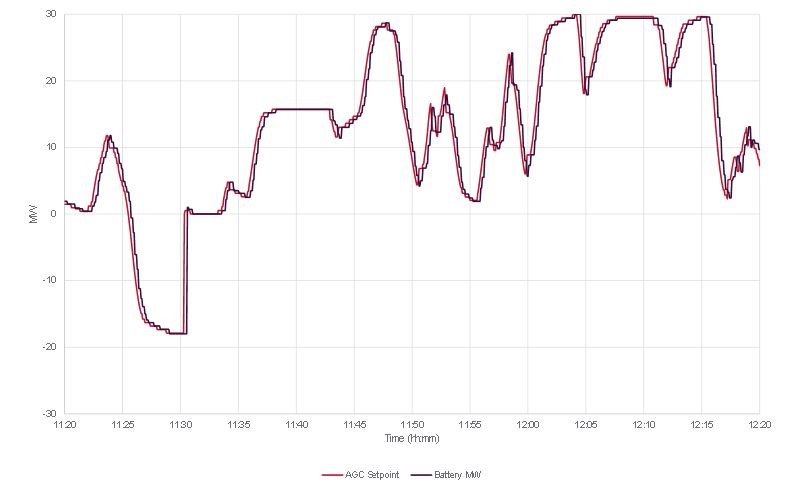
Source: AEMO
It also noted that regulation FCAS arrangements in the NEM do not currently recognise differences in the quality of service delivery, so all regulation FCAS is essentially considered to be equal and interchangeable with providers paid the same per MW regardless of the performance.
The HPR has been designed to provide contingency FCAS response at all times irrespective of the FCAS market outcomes. AEMO notes that commissioning tests and simulations confirm that it is capable of responding more rapidly to a contingency event than conventional synchronous generation.
The market operator concludes that the operation of the HPR to date suggests it can provide a range of valuable power system services, including rapid, accurate frequency response and control.
AEMO has flagged that current FCAS market arrangements could also be modified to specifically recognise the rapid and accurate response capabilities of batteries, and therefore enhance their ability to earn income from providing them. In this way, despite the small scale of the Hornsdale Power Reserve in comparison to the overall size of the NEM, it is nevertheless providing very useful information as a demonstration project. AEMO’s publication of these learnings is very useful for commercial investors and we will hopefully see more of this useful information over time.
Of course, there is a very long way to go before the NEM could relinquish its dependence on synchronous plant for the majority of its stability requirements, but so far Hornsdale seems a good start.
[i] This article first appeared in WattClarity http://www.wattclarity.com.au/2018/03/fcas-in-action-what-happens-when-a-generator-trips/. The author, Allan O’Neil, has worked in Australia’s wholesale energy markets since their creation in the mid-1990’s, in trading, risk management, forecasting and analytical roles with major NEM electricity and gas retail and generation companies. He is now an independent consultant.
[ii] See AEMO’s comments regarding the rapid response of batteries and inclusion of HPR in the System Integrity Protection Scheme currently being developed in South Australia: Initial Operation of the Hornsdale Power Reserve Battery Energy Storage System, s1.1.4, p4. Available at https://www.aemo.com.au/Media-Centre/AEMO-Hornsdale-report
Related Analysis
Consumer Energy Resources: The next big thing?
The Consumer Energy Resources Roadmap has just been endorsed by Energy and Climate Change Ministers. It is considered by government to be the next big reform for the energy system and important to achieving the AEMO’s Integrated System Plan (ISP). Energy Minister, Chris Bowen, recognises the key will be “making sure that those consumers who have solar panels or a battery or an electric vehicle are able to get maximum benefit out of it for themselves and also for the grid”. There’s no doubt that will be important; equally there is no doubt that it is not simple to achieve, nor a certainty. With the grid intended to serve customers, not the other way around, customer interests will need to be front and centre as the roadmap is rolled out. We take a look.
Australia’s workforce shortage: A potential obstacle on the road to net zero
Australia is no stranger to ambitious climate policies. In 2022, the Labor party campaigned on transitioning Australia’s grid to 82 per cent renewable energy by 2030, and earlier this year, Prime Minister Anthony Albanese unveiled the Future Made in Australia agenda, a project which aims to create new jobs and opportunities as we move towards a net zero future. While these policies have unveiled a raft of opportunities, they have also highlighted a major problem: a lack of skilled workers. Why is this a problem? We take a closer look.
Made in Australia: The Solar Challenge
While Australia is seeking to support a domestic solar industry through policy measures one constant question is how Australia can hope to compete with China? Australia currently manufactures around one per cent of the solar panels installed across the country. Recent reports and analysis highlight the scale of the challenge in trying to develop homegrown solar manufacturing, as does the example of the US, which has been looking to support its own capabilities while introducing measures to also restrict Chinese imports. We take a look.
Send an email with your question or comment, and include your name and a short message and we'll get back to you shortly.