

by Duncan MacKinnon
SA EnergyConnect: RiverLink with rigour
Last week ElectraNet issued its SA Energy Transformation RIT-T Project Assessment Conclusions Report, which proposes a $1.5 billion 800MW 330kV 920km interconnector between South Australia and New South Wales.
The interconnector would be commissioned in 2022 and deliver net market benefits of ~$900m over 21 years. In addition to its previously recommended proposala, the subject of its June 2018 Project Assessment Draft Report,[i] ElectraNet has suggested adding a $46 million 500MW 220kV 24km line from Buronga in NSW to Red Cliffs in Victoria. The spur line would facilitate the connection of additional solar capacity in western Victoria, providing increased access for the plant to the Sydney and Adelaide load centres.
While the Australian Electricity Market Operator (AEMO) dubbed the project RiverLink in its Integrated System Plan (ISP),[ii] ElectraNet has now settled on the name “Project EnergyConnect”.[iii]
Figure 1: Project EnergyConnect’s Preferred Route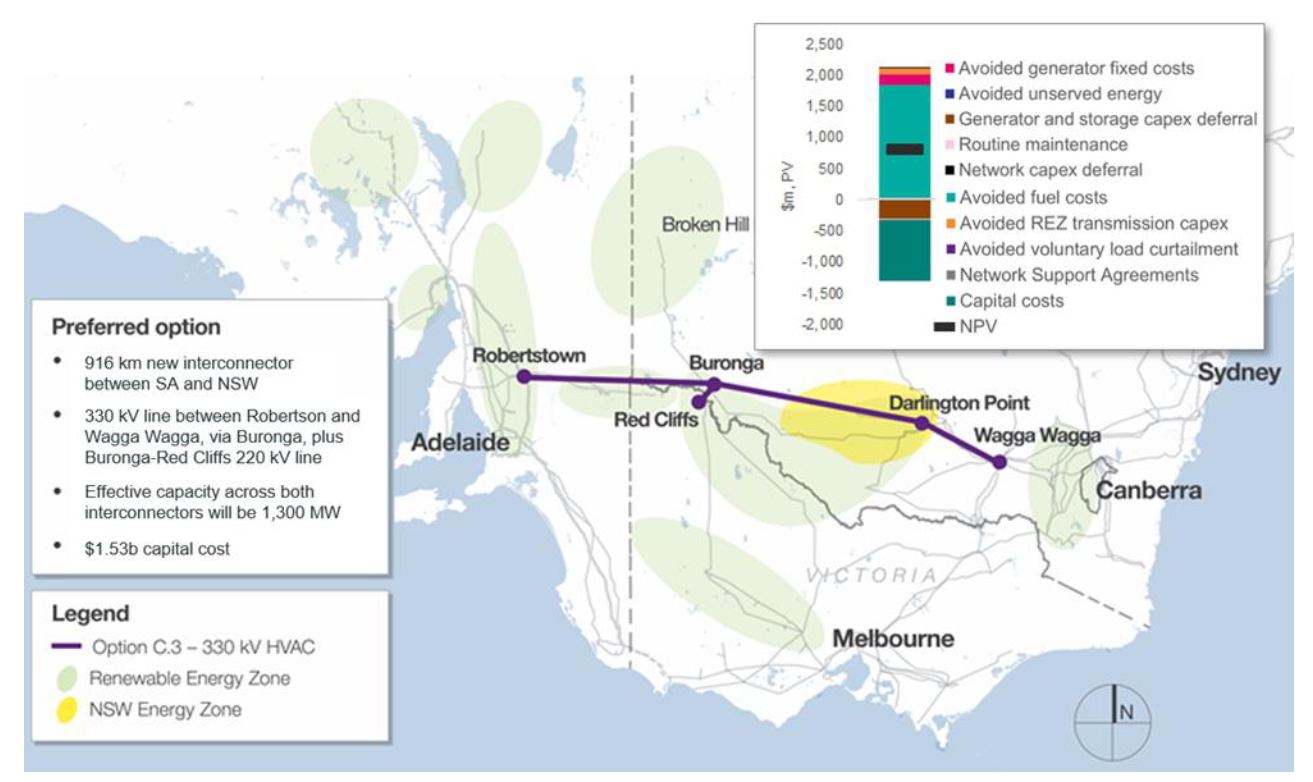 Source: South Australian Energy Transformation RIT-T Project Assessment Conclusions Report, p.5
Introduction
Under the Regulatory Investment Test for Transmission (RIT-T) process set out in National Electricity Rules 5.15 and 5.16, transmission network service providers (TNSPs) must perform a cost-benefit analysis before undertaking major network investments. This cost-benefit analysis must consider reasonable alternatives, including non-network options, in their assessment of the best option to maximise the present value of the net economic benefit to all those who produce, consume and transport electricity.[iv] The TNSP’s assessment must follow the guidelines published by the Australian Energy Regulator (AER).[v]
The Costs
Broadly speaking ElectraNet considered four options:
- a “non-interconnector” option involving local network reinforcement;
- a high voltage direct current (HVDC) link from SA to Western Downs (approximately 300km north-west of Brisbane);
- a range of alternatives to link SA with NSW; and,
- a new interconnector between SA and Victoria.
These options are shown below, and range in price between $1.2 billion and $2 billion.
|
|
Option |
Distance (km) |
Cost |
Capacity (MW) |
|
A |
Non-interconnector |
N/A |
$110m p.a. |
N/A |
|
B |
Qld Interconnector |
1,450 |
$2.0b |
700 |
|
C |
NSW Interconnector |
920–1,020 |
$1.5-1.7b |
800 |
|
D |
Vic Interconnector |
510 |
$1.2b |
650 |
The Benefits
Benefits from each possible option were considered using “High”, “Central” and “Low” scenarios.[vi]
The market benefits of the various options were assessed using the following categories:
- changes in fuel consumption arising through different patterns of generation dispatch – primarily a reduction in gas usage in SA due to increased supply from lower cost electricity in other regions;
- a reduction in generator capital and fixed operating costs, primarily in SA, due to the changing generation mix due to the new interconnector;
- a longer-term benefit in utilising the diversity of low-cost renewable generation in SA and NSW;
- relief of the RoCoF constraint on the Heywood interconnector and the cap on non-synchronous generation; and,
- facilitation of the development of some of the Renewable Energy Zones (REZs) identified by AEMO in the ISP, avoiding the need for additional intra-regional transmission investment.
The present value of these benefits is shown in the following graph:
Figure 2: Breakdown of estimated net market benefits – central scenario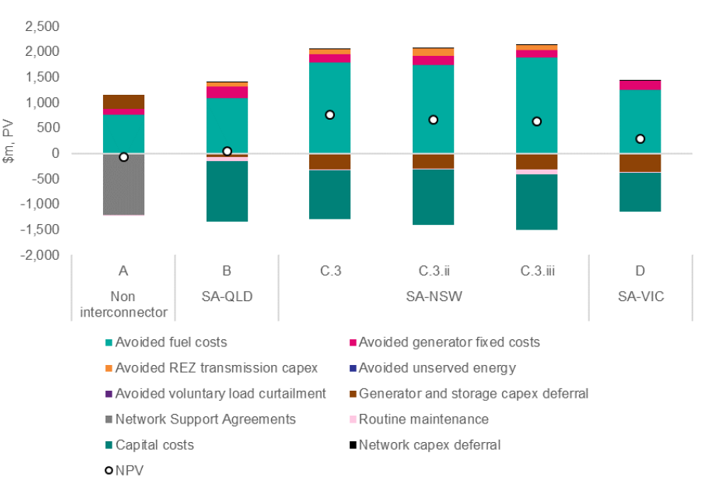
Source: Project Assessment Conclusions Report, p.96
Results
Using the estimated capital costs, the different options were assessed by determining their net present values (NPV) under the different scenarios (High, Central, Low and Weighted). In each case Option C.3 (330kV interconnection between SA and NSW, along with the Buronga-Red Cliffs spur line) reported the highest NPV.
Discussion
ElectraNet has worked very hard to address submissions it received in response to the Project Assessment Draft Report, which Energy Insider covered in July 2018 - RiverLink: Don’t spend the savings all at once! The analysis is significantly more robust, and some assumptions such as a more stringent inertia requirement of 1Hz/s have been tempered. In addition, ElectraNet has included an increased number of sensitivities to demonstrate that stakeholders’ concerns would not jeopardise the viability of the proposed solution. Nevertheless, as with all such business cases, there are many uncertainties that risk, in hindsight, proving the forecasting wrong.
Local Renewable Generation
SA currently has about 2,300MW of renewable capacity.[vii] In the pipeline is 463MW of committed renewable generation and 6,353MW[viii] of proposed renewable generation.[ix] In addition, there will be increased distributed generation in the form of rooftop PV and domestic batteries. SA’s all-time peak demand is 3,397MW on 31 January 2011.
NSW currently has about 2,100MW of large-scale solar and wind plus 3,000MW of hydro. In the development pipeline is 1,520MW of committed renewable generation and 14,337MW[x] of proposed renewable generation[xi] (in addition to any distributed generation that is installed). NSW’s all-time peak demand is 14,764MW on 1 February 2011.
Much of the net market benefits, as shown in Figure 2 above, are attributable to gas cost savings, primarily in SA, but also in NSW as a result of the new interconnector. With the impending influx of such large quantities of renewable capacity in each region, presumably the gas-fired generation being displaced occurs in times of lulls in the wind and sun.
Inclusion of Buronga-Red Cliffs Spur Line
The Project Assessment Conclusions Report (PACR) has included the 220kV 24km spur line from Buronga to Red Cliffs based on AEMO’s assessment that it will provide incremental net market benefit. The analysis presented suggest that the benefits would be in the order of $184 million for an expenditure of $46 million.[xii] However the analysis assumes 500MW will connect in western Victoria, where connections to this generation capacity are already subject to their own Western Victoria RIT-T.[xiii]
One of the great challenges for the regulator in overseeing the RIT-T is to ensure that separable projects are subject to individual cost-benefits, so a bad project cannot be carried along by a good one. There is a question of whether this spur transmission line should be subject to its own RIT-T process rather than being part of the SA-NSW Interconnector.
Overall Benefits to Customers
As we previously reported, despite headline numbers showing significant overall market benefits, the case for customers is not as compelling. The revised findings from ACIL Allen show that customers in SA will be better off overall by $66 p.a. over the period to 2030, while NSW customers’ lot will be improved by $30 p.a. Customer benefits, however, are not the basis of the RIT-T. This is discussed in another Energy Insider article in July 2018 – Building Transmission in a Market.
Identified Need
The Project Assessment Draft Report listed one of the identified needs as “enhancing security of electricity supply, including management of inertia, frequency response and system strength in South Australia”.[xiv] With the introduction of measures such as synchronous condensers to improve SA’s system strength, this identified need has withered, with the PACR stating, “the options considered in this RIT-T are no longer a primary source of system security benefits for South Australia”.[xv]
Group 2 Urgency
Finally, the PACR stresses the need for the project’s immediacy, reporting that AEMO’s ISP identified the project as a Group 2 project “that should proceed as soon as possible”.[xvi] By our reading this is not entirely consistent with the ISP, which describes Group 2 projects as “action [needing] be taken now, to initiate work on projects for implementation by the mid-2020s”.[xvii]
Conclusion
Previously we expressed reservations about the transparency of the justification for this interconnector, but the Australian Energy Council is pleased to note that this has much improved in this second stage. This is perhaps an endorsement for the existing RIT-T staged approach of consultations. Whilst sometimes frustrating for network companies, it provides greater confidence for stakeholders that appropriate due diligence is undertaken before such a major, irreversible decision is made which will both burden customers with costs and affect commercial investments. This is particularly the case when building a 40-year $1.5 billion asset for a power system which is in the midst of fundamental transition.
[i] Available at https://www.electranet.com.au/wp-content/uploads/projects/2016/11/2018-07-06-SAET-PADR-Final.pdf
[ii] AEMO, Integrated System Plan, July 2018, p.8
[iii] http://www.projectenergyconnect.com.au/
[iv] National Electricity Rule 5.16.1(b)
[v] Australian Energy Regulator, Regulatory Investment Test for Transmission Application Guidelines, 14th December 2018
[vi] The Weighted Scenario weighted the scenarios as follows: High 25%, Central 50%, Low 25%.
[vii] AEMO NEM Registration and Exemption List, available at http://www.aemo.com.au/Electricity/National-Electricity-Market-NEM/Participant-information/Current-participants/Current-registration-and-exemption-lists
[viii] Solar, wind, water & biomass
[ix] AEMO Regional Generation Information Page for SA dated 21st January 2019, available at http://www.aemo.com.au/Electricity/National-Electricity-Market-NEM/Planning-and-forecasting/Generation-information
[x] Solar, wind, water & biomass
[xi] AEMO Regional Generation Information Page for NSW dated 21st January 2019, available at http://www.aemo.com.au/Electricity/National-Electricity-Market-NEM/Planning-and-forecasting/Generation-information
[xii] Incremental NPV Benefits of Red Cliffs to Buronga Line, available at https://www.electranet.com.au/projects/south-australian-energy-transformation/
[xiii] Available at http://www.aemo.com.au/Electricity/National-Electricity-Market-NEM/Planning-and-forecasting/Victorian-transmission-network-service-provider-role/RITT
[xiv] PADR, p.5
[xv] PACR, p.37
[xvi] PACR, p.6
[xvii] AEMO, Integrated System Plan, July 2018, p.9
Related Analysis
Retail protection reviews – A view from the frontline
The Australian Energy Regulator (AER) and the Essential Services Commission (ESC) have released separate papers to review and consult on changes to their respective regulation around payment difficulty. Many elements of the proposed changes focus on the interactions between an energy retailer’s call-centre and their hardship customers, we visited one of these call centres to understand how these frameworks are implemented in practice. Drawing on this experience, we take a look at the reviews that are underway.
Data Centres and Energy Demand – What’s Needed?
The growth in data centres brings with it increased energy demands and as a result the use of power has become the number one issue for their operators globally. Australia is seen as a country that will continue to see growth in data centres and Morgan Stanley Research has taken a detailed look at both the anticipated growth in data centres in Australia and what it might mean for our grid. We take a closer look.
Green certification key to Government’s climate ambitions
The energy transition is creating surging corporate demand, both domestically and internationally, for renewable electricity. But with growing scrutiny towards greenwashing, it is critical all green electricity claims are verifiable and credible. The Federal Government has designed a policy to perform this function but in recent months the timing of its implementation has come under some doubt. We take a closer look.
Send an email with your question or comment, and include your name and a short message and we'll get back to you shortly.