

by Duncan MacKinnon
RiverLink: Don’t spend the savings all at once!
In 2016 a proposal for an electricity interconnector between South Australia and New South Wales was put on the table as a way to help address SA’s energy issues. An original interconnector proposal known as RiverLink with a projected cost of about $110 million was scrapped when the state’s electricity assets were privatised for about $5 billion in 1999.[i]
The previous State Labor Government agreed to partly fund a feasibility study into an interconnector, while prior to the SA state election earlier this year, the-then Liberal opposition committed to a $200 million interconnection fund to “provide South Australians with access to cheap baseload power, a more reliable supply and more opportunities to export renewable energy”.
Project Assessment
Now ElectraNet has issued its SA Energy Transformation RIT-T Project Assessment Draft Report (PADR), which proposes a $1.5 billion 800MW, 330kV, 920km interconnector between SA and NSW for consideration.
The PADR targets a commissioning between 2022 and 2024 and says the project would deliver net market benefits of more than $1 billion over 21 years. ElectraNet also found that a new high capacity interconnector between SA and NSW would deliver substantial economic benefits “as soon as it can be built”.
Figure 1: Indicative interconnector route
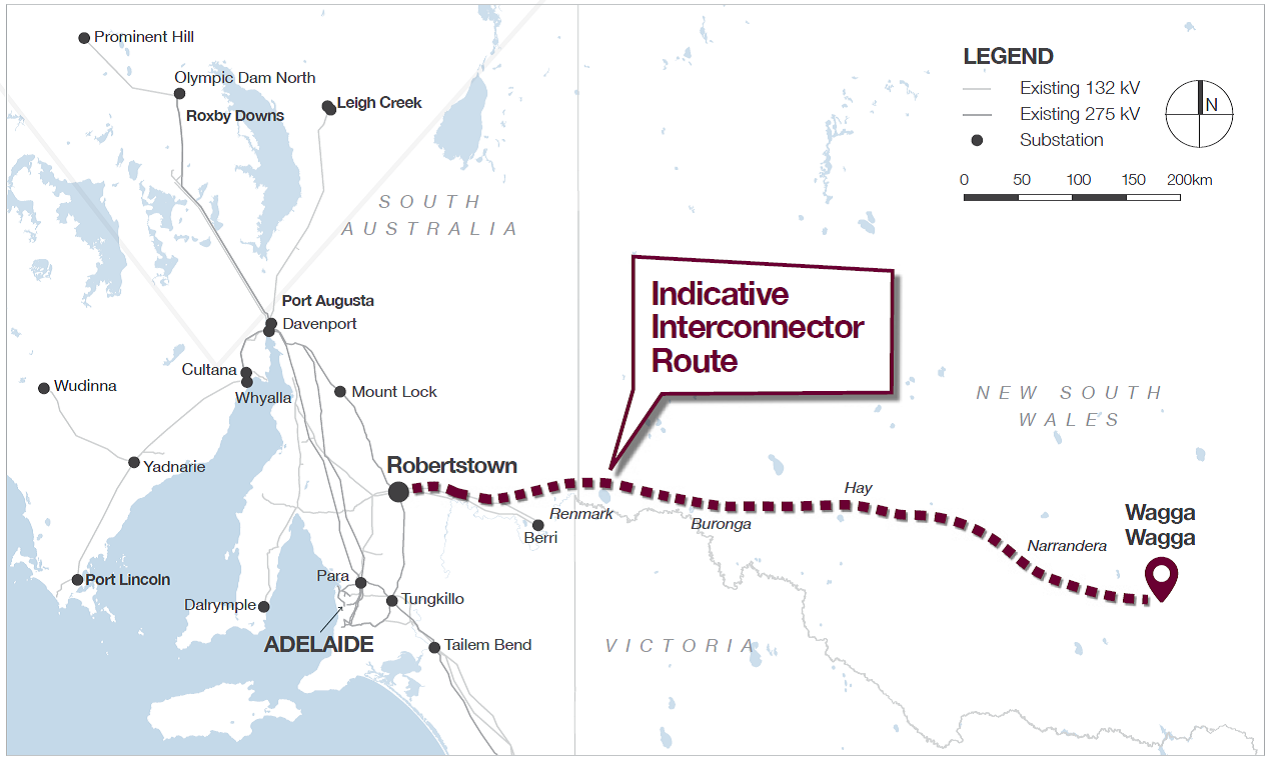 Source: South Australian Energy Transformation Information Sheet, June 2018
The project, referred to by Australian Energy Market Operator (AEMO) as RiverLink, is now running its course through the normal Regulatory Investment Test for Transmission (RIT-T) process set out in National Electricity Rules 5.15 and 5.16. Under this process, transmission network service providers (TNSPs) must perform a cost-benefit analysis before undertaking major network investments. This cost-benefit analysis must consider reasonable alternatives, including non-network options, in its assessment of the best option to maximise the present value of the net economic benefit to all those who produce, consume and transport electricity.[ii] The TNSP’s assessment must follow the guidelines published by the Australian Energy Regulator.[iii]
The Costs
Broadly speaking ElectraNet considered four options “aimed at reducing the cost of providing secure and reliable electricity to SA in the near term, while facilitating the longer-term transition of the energy sector across the NEM to low emission energy sources”:[iv]
- a “non-interconnector” option involving local network reinforcement;
- a HVDC link from SA to Western Downs (approximately 300km north-west of Brisbane);
- a range of alternatives to link SA with NSW; and,
- different alternatives for a new interconnector between SA and Victoria.
These options are shown below, and range in capital expenditure between $0.8b and $2.9b.
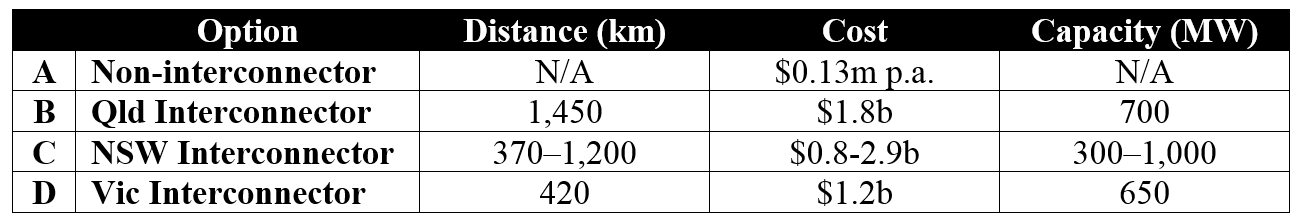
ElectraNet also considered a base case, which considered what would happen if it didn’t proceed with any of the projects.
The Benefits
Benefits from each possible option were considered using “High”, “Central” and “Low” scenarios, with all three scenarios weighted to synthesise a representative assessment for comparison between the options.
The market benefits of the various options were assessed using the following categories:
- changes in fuel consumption arising from different patterns of generation dispatch – primarily a reduction in gas usage in SA due to increased supply from coal-fired generation in NSW;
- changes in third party costs, e.g. savings from the retirement of conventional plant, offset by investment in new plant such as renewables;
- deferral of transmission investment identified by AEMO as required for the development of priority Renewable Energy Zones (REZs);
- relief of constraints on existing and planned windfarms and the consequential avoidance of Large-scale Renewable Energy Target charges (immaterial);
- reduction in unserved energy (assessed to be zero due to security of supply measures currently being undertaken);
- changes in voluntary load curtailment (not material); and,
- changes in network losses.
The present value of these gross market benefits is shown in the following graph:
Figure 2: Breakdown of gross market benefits – Central Scenario
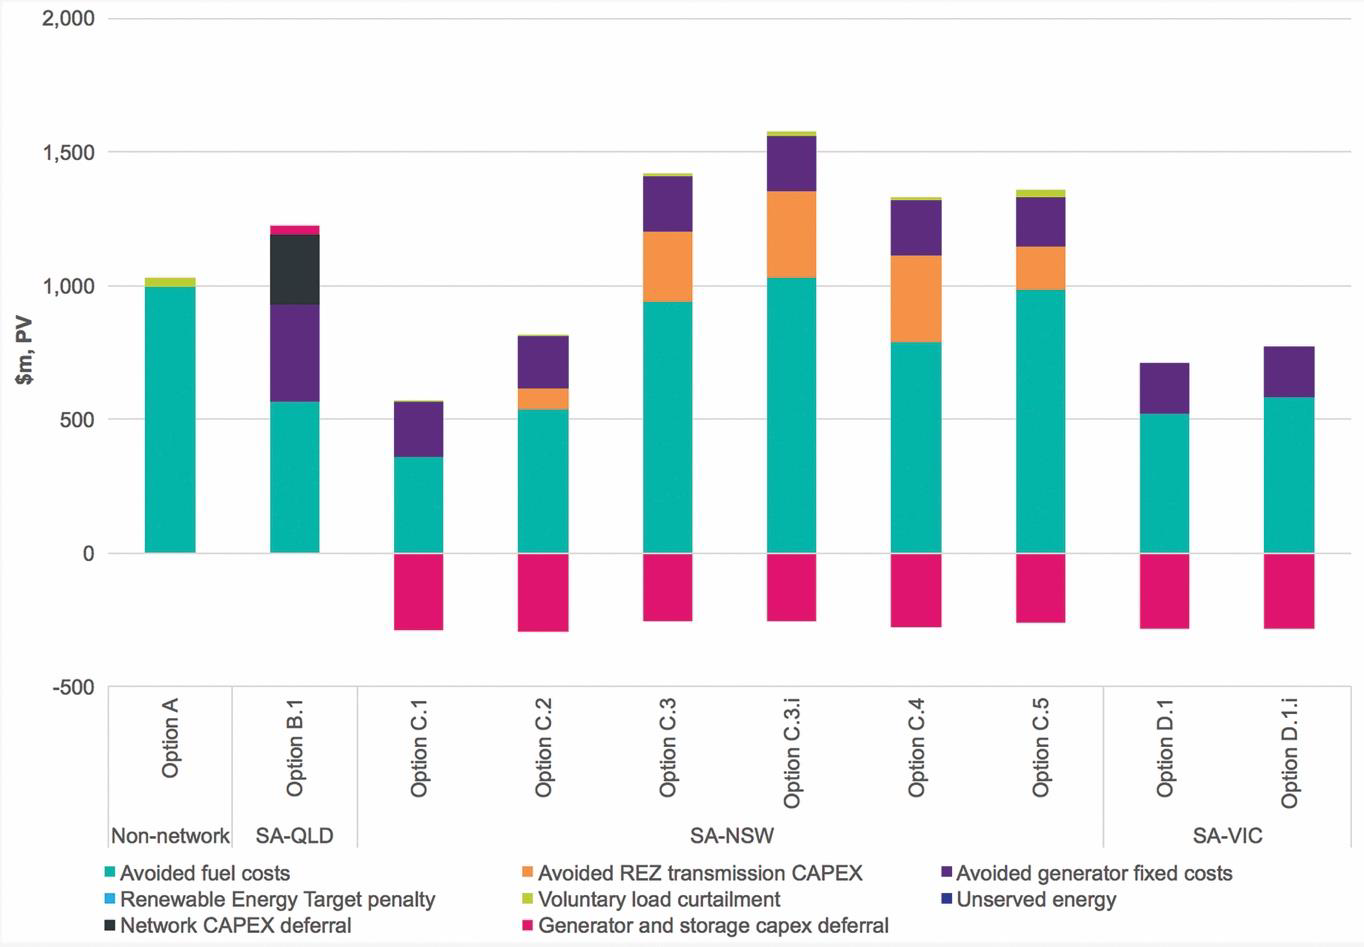 Source: Project Assessment Draft Report, p.80
Results
Using the estimated capital costs, the different options were assessed by determining their net present values (NPV) under the different scenarios (High, Central, Low & Weighted).[v] In each case Option C.3i (330kV interconnection between SA and Wagga Wagga along with 50 per cent series compensation between Robertstown and Buronga) reported the highest NPV, although it’s worth noting that AEMO’s Integrated System Plan reports that even with newly installed synchronous condensers and RiverLink, SA may still require remedial action to keep system strength and inertia within acceptable limits.[vi],[vii]
Discussion
The Energy Council has identified some initial observations about the RIT-T. Some of these concerns are due to the gestation period of the project, which first commenced in 2016. While the assessment period has been long, the approvals, detailed design and construction will also take significant time, with commissioning being scheduled for between 2022 and 2024.[viii] Over the coming five years there may be:
- governmental policy changes (either at state or federal level);
- market changes such as increased distributed generation;
- declining technology costs; and,
- regulatory environment changes (such as outcomes from the Generator Technical Performance Standards Rule Change, Reliability Frameworks Review, Frequency Control Frameworks Review, etc.).
In addition, any announcement that RiverLink will proceed will affect generation proponents and may have substantive effects on both the spot and contract markets, including increasing short-term volatility, particularly in the lead-up to commissioning.
These risks point to a need for caution in embracing any transmission network solution, particularly as market forecasts out to 2040 are likely to be uncertain, affected by major market changes such as the introduction of five minute settlement, and perhaps skew the preferred option to cheaper solutions which don’t expose so much capital to the risk of the future not playing out as forecast.
Market Benefits
As mentioned above, the PADR considers different scenarios, and focuses on reporting the results of the Weighted Scenario as an even-handed assessment of different possible outcomes. The net market benefits are shown in the following graphs (note the difference from gross market benefits shown in the previous graph), reproduced from page 85 of the report.
Figure 3: Net market benefits – all scenarios
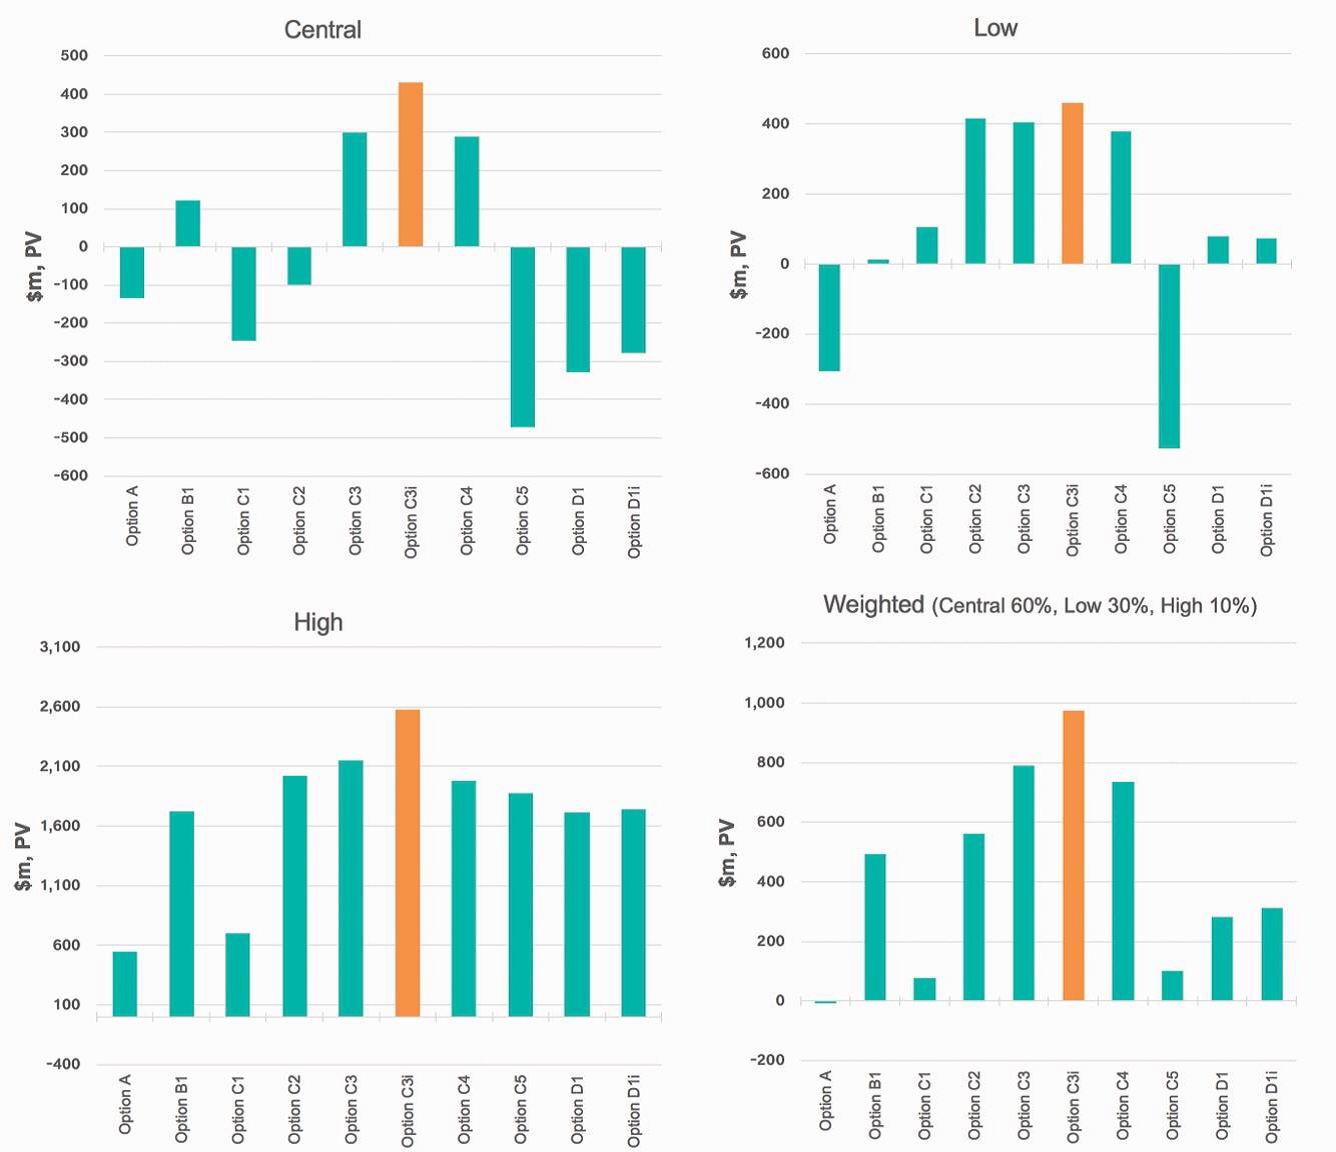 Source: Project Assessment Draft Report, p.85 (Note that although the title of the Weighted graph reports the weightings as 60:30:10, the body of the report refers to 25:50:25 weightings.)
Comparing the preferred option, C3i (shown in orange) across the different scenarios, there is little difference between the Central and Low scenarios. However the High case reports a value about six times the value for the Central case. This has the effect of skewing the Weighted case appreciably towards the High Scenario’s outcome. A review of the assumptions in the High Scenario suggests that, although capital costs have been conservatively assumed to increase by 15 per cent, other parameters such as a more stringent RoCoF limit and higher gas prices have resulted in an unrealistic outcome being reported. For example, the report’s analysis of sensitivities shows that the RoCoF limit change adds approximately $500m to Option C3’s market benefits PV.[ix]
The assessment of market benefits attributes value to the avoided costs associated with Renewable Energy Zones. In the case of the preferred option, this is in the order of $300m. While REZs are a concept introduced by the Finkel Review, they have no present standing and their inclusion seems speculative. It is worth questioning whether their value should be included in the assumed market benefits.
The Energy Council also questions whether the quantitative assessment used is the most appropriate. NPV is a measure to assess the profitability of a project by considering the project’s discounted cash inflows and outflows over the term of the project. It does not consider the quantum of capital required to complete a project and in that sense there are other measures, such as the cost-benefit ratio, or profitability index, which serve better as an indicator of how efficiently the TNSP’s capital would be employed. For example, a $200m 100MW project returning $400m in benefits (hence NPV = $200m) would be appreciably better for consumers than a $500m 400MW project returning $700m (again, with NPV = $200m). To this end, the Energy Council believes it is important to consider the capital efficiency of the projects being proposed, not just the gross NPV returned, and to reduce the effects of forecast error, choose options with less capital exposure.
This is reinforced by the findings of ACIL Allen’s preliminary analysis of the potential impact on electricity prices,[x] which found that, in nominal terms, over the first three years to 2026, annual residential customer bills would reduce by “up to about $30 in South Australia and $20 in New South Wales” for representative customers.[xi] Given annual customer bills for the customers modelled would be about $1,727 (SA) and $1,697 (NSW),[xii] this represents a 1.7 per cent (SA) and 1.2 per cent (NSW) discount on their bills. While the transmission network cost impact of $9 p.a. (SA) or $5 p.a. (NSW), could also be classed as negligible, the Energy Council suggests that the customer benefit (and its associated risk) is not a compelling case for project approval.
Looped Regions
An interesting feature of the proposed SA to NSW link is that with the existing regional boundaries it would introduce a loop in the dispatch representation. This creates a number of particular challenges that were experienced prior to the abolition of the Snowy Region. In fact they would be likely to be more severe in this case.
The existing NEM dispatch engine is built with a radial (or hub and spoke) simplified model of the network, as if no network loops exist. The linear program is not directly able to optimise a regional loop. It is possible, by implementing some rather complex additional features, that dispatch could approach an optimisation of loop flow.
However that then will introduce a new settlement challenge. Loops always exhibit “spring washer effects” where some links in the loop flow pro-price while other links flow counter-price. This results in a settlement deficit on the counter-price flow, albeit smaller than the settlement surplus achieved across the other links. The NEM’s settlement residue auction arrangement is not set up to deal with these intentional settlement deficits.
This is not a problem to be solved by the TNSPs in the regulatory test, but for the market design. A very simple solution would be to retain the radial model through a small regional boundary shift such that the new interconnector, from a dispatch and settlement perspective, travels via the Victorian region.
Conclusion
What exactly the problem is that is being solved here is difficult to distil, but it doesn’t appear to provide much benefit for the end user. Rightly, frustration with high energy prices in SA has driven a response from both Government and the Opposition. However the ElectraNet options in our view have overstated the benefits (such as attributing value to the avoided costs of the REZs) and understated the costs (a reduction in gas usage in SA due to increased supply from coal-fired generation in NSW, a less predictable outcome than might be apparent with current government policy uncertainty) to some considerable extent. The focus on the gross NPV of projects, rather than their capital efficiency, is also not in the best interests of consumers. Reduced to the individual customer level, the project struggles to be convincing. How to achieve a sustained reduction in energy prices in South Australia has never been a simple problem.
[i] https://www.afr.com/business/energy/electricity/south-australias-answer-to-high-power-prices-may-be-to-join-nsw-grid-20160614-gpipkh
[ii] National Electricity Rule 5.16.1(b)
[iii] Australian Energy Regulator, Regulatory Investment Test for Transmission Application Guidelines, 18th September 2017
[iv] PADR, p.3
[v] The Weighted Scenario weighted the scenarios as follows: High 25%, Central 50%, Low 25%.
[vi] Australian Energy Market Operator, Integrated System Plan, July 2018, p.71
[vii] Ibid., p.81
[viii] PADR, p.59
[ix] PADR, Figure 15, p.89
[x] ACIL Allen, South Australia New South Wales Interconnector Preliminary Analysis of Potential
Impact on Electricity Prices, 3rd July 2018
[xi] ACIL Allen, p.10
[xii] Australian Competition and Consumer Commission, Restoring electricity affordability and Australia’s competitive advantage: Retail Electricity Pricing Inquiry–Final Report, June 2018, Figure 1.4, p.8
Related Analysis
Retail protection reviews – A view from the frontline
The Australian Energy Regulator (AER) and the Essential Services Commission (ESC) have released separate papers to review and consult on changes to their respective regulation around payment difficulty. Many elements of the proposed changes focus on the interactions between an energy retailer’s call-centre and their hardship customers, we visited one of these call centres to understand how these frameworks are implemented in practice. Drawing on this experience, we take a look at the reviews that are underway.
Data Centres and Energy Demand – What’s Needed?
The growth in data centres brings with it increased energy demands and as a result the use of power has become the number one issue for their operators globally. Australia is seen as a country that will continue to see growth in data centres and Morgan Stanley Research has taken a detailed look at both the anticipated growth in data centres in Australia and what it might mean for our grid. We take a closer look.
Green certification key to Government’s climate ambitions
The energy transition is creating surging corporate demand, both domestically and internationally, for renewable electricity. But with growing scrutiny towards greenwashing, it is critical all green electricity claims are verifiable and credible. The Federal Government has designed a policy to perform this function but in recent months the timing of its implementation has come under some doubt. We take a closer look.
Send an email with your question or comment, and include your name and a short message and we'll get back to you shortly.