

by Carol Tran
Renewables on a new trajectory
The International Energy Agency (IEA)’s latest report, the Medium Term Renewable Energy Market Report 2016, provides a forecast of renewable energy growth over the next six years. With renewable energy overtaking coal in terms of net annual additions to installed power capacity in the world for the first time in 2015. The report also highlights that annual renewable electricity capacity growth reached a record high of 153 gigawatts (GW) in 2015, 15 per cent higher than previous years, and described last year as a “tipping point” for renewables.
How has the International Energy Agency changed its forecasts?
The IEA’s total power demand and generation forecasts for major markets are based on expectations for real gross domestic product, which are continuously updated when new historical data becomes available. Previous IEA publications underestimated the expansion of renewable energy, where the rapid growth and plummeting costs of renewables continue to outpace forecasts. The IEA said that it was “significantly increasing” its six-year renewable growth forecast[i] and this assessment is included in the accelerated-case projection in the 2016 report. Figure 1 and 2 shows how IEA forecasts have changed over the past four years.
The IEA’s 2014 and 2015 forecasts were revised down to be lower than the previous year because of a slower-than-expected expansion in China and in the non-OECD Americas. Specifically, wind has been revised down in China, OECD European countries, the United States and Australia, while the outlook for solar photovoltaic (PV) has been revised up in China and Japan. The IEA’s 2016 report’s main case forecast was revised to have the strongest increase compared with last three years (Figure 1). The 2016 report forecasts renewables growth of 13 per cent between 2015 and 2021 compared the previous six-year projection. Stronger policy backing in the United States, China, India and Mexico contribute to the rise in this latest forecast. The continued strong cost reductions of new solar and wind capacity, which increase the cost-competitiveness and improve the attractiveness of renewables among policy-makers and investors are important contributors to this growth.
Figure 1: International Energy Agency’s forecasts of renewable electricity capacity (GW)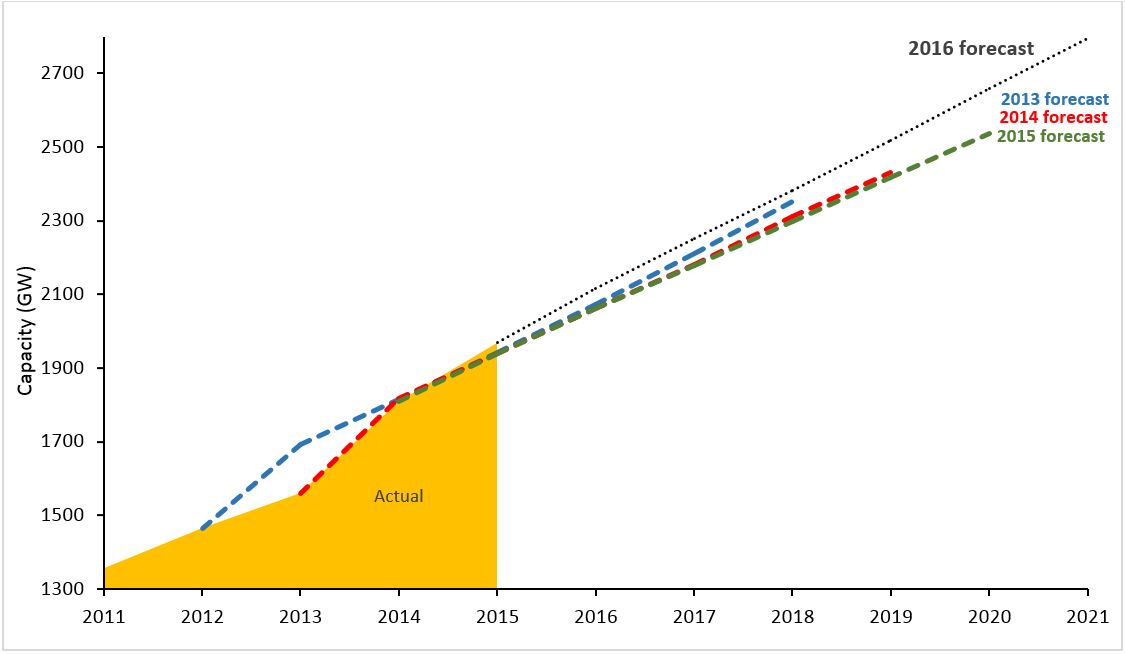
Source: International Energy Agency, REN21[ii], Energy Council’s Analysis, 2016
While cumulative capacity will grow, as with its 2014 and 2015 reports the IEA’s latest assessment forecasts a downward trend in terms of the annual new renewable capacity additions, where 148 GW of renewable capacity is expected to be added in 2016, 134 GW in 2017 and 131 GW in 2018 (Figure 2). For Australia, the IEA forecasts renewable capacity will increase by 9 GW over the medium term with generation expected to grow by 70 per cent and reach 54 TWh by 2021.
Figure 2: International Energy Agency’s forecasts of global renewable capacity additions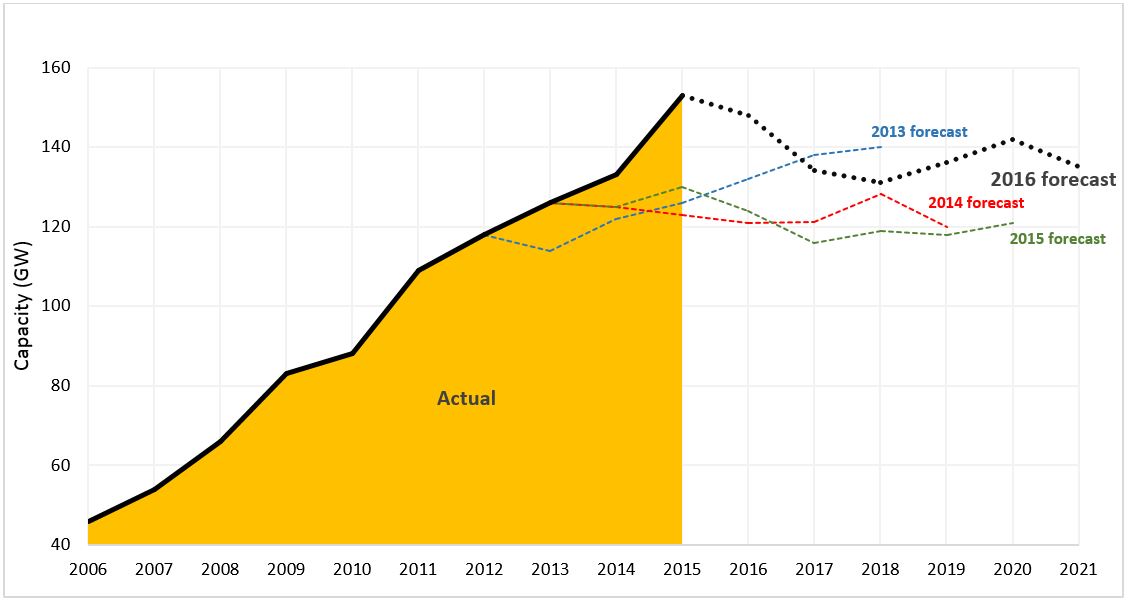
Source: International Energy Agency, Energy Council’s Analysis, 2016
Complex deployment dynamics and market challenges
Despite the rapid growth and a record expansion in 2015, with renewables representing more than half the new power capacity around the world at a record 153 gigawatts (GW), the IEA said growth was still concentrated in solar and wind. Between 2015 and 2021, solar PV generation is forecast to triple and wind to double, while hydropower only grows by 13 per cent, albeit from a much larger base.
Renewable energy development is becoming more complex as renewables increase their share in the global power mix. According to the IEA the expansion of renewable energy, coupled with slower electricity demand growth, is revealing many energy market challenges. In China, for example, the wind curtailment rate peaked at 21.2 per cent in the first half of 2016, which is 6 per cent higher than in 2015[iii][iv]. China’s renewable integration challenge is due to both the rapid expansion of wind capacity and lower demand growth. India is forecast to lead renewables growth in Asia (behind China) with renewable capacity doubling to almost 160 GW over the outlook period. Increased competition and decreasing costs are key drivers; yet weak grid infrastructure continues to limit the deployment.
The IEA identifies that additional policy initiatives in a number of key markets (including China, US, India, the European Union and Brazil) addressing some of these challenges could have significant impacts on renewable capacity growth over the forecast period. The IEA report includes accelerated case projections for renewable capacity to illustrate the impact of market and policy changes on renewable deployment. While climate change mitigation is a powerful driver for renewable growth, improving air quality is another factor, especially in densely populated “key emerging markets” (China, India and ASEAN).
Achieving the accelerated growth case would require policy makers to address “three important challenges to deployment”. These are:
- Improving grid integration of renewables through addressing infrastructure challenges and market design issues;
- Implementing stable and sustainable policy frameworks that give greater revenue certainty to capital-intensive renewables by reducing policy uncertainties; and,
- Developing policy mechanisms that reduce the cost of financing and lower off-taker riskers especially in developing countries and emerging economies.
Under the accelerated case projection, global renewable capacity growth could be 29 per cent higher compared to the main case forecast.
Looking ahead
In 2015, the weighted average solar PV system prices for both utility- and residential-scale projects continued to decrease. Average system prices for commissioned solar PV projects ranged from USD 1200/kW to USD 2400/kW with the lowest prices observed in Germany, China and India (Figure 3).
Japan has high solar PV costs due to land availability constraints and grid connection and project permitting challenges. In the United States, relatively high average system prices in 2014-15 for utility-scale projects is subject to the “commissioning of relatively high-cost projects signed with supply contracts and power purchasing agreements over 2011-13”. Australia has a mature solar PV market with a competitive supply chain which led to relatively low prices in 2014-15.
Figure 3: Typical solar PV average system prices for commissioned projects (2014-15)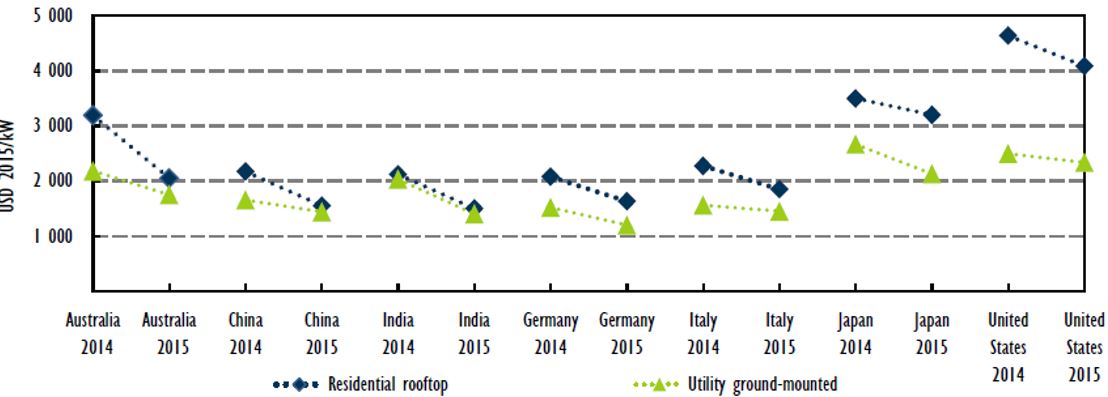
Source: Medium-Term Renewable Energy Market Report 2016
Moving forward, the IEA expects onshore wind generation costs to fall by 15 per cent, while utility-scale solar PV costs are expected to fall by 25 per cent over the projection period 2015 to 2021.
Meanwhile, progress in renewable growth in heat and transport sectors remains slow and needs significantly stronger policy efforts, according to the Agency. Renewable heat technologies, which include bioenergy, solar thermal and geothermal, are mainly used for heating in residential and commercial buildings. These technologies provided 7.2 per cent of heat demand in 2014. As a large proportion of heating systems in the EU market are operating beyond their technical lifetime, progress is being made in replacing existing heating systems. IEA expects a “slightly higher rate, with an annual average growth rate of 2.7 per cent” in renewable heat. Besides, annual growth rate of biofuels production used in transportation is expected to increase 2.9 per cent on average. Supportive biofuel policies have been strengthened in Australia, Argentina, Brazil, India, Indonesia and Spain, that the IEA has raised its 2015 forecast of 1.8 per cent. The 2016 forecast rate is, however, subject to be constrained due to the potentially disruptive impact on crops and harvest conditions from temperature changes because of the strong 2015-16 El Nino weather event
Conclusion
Over the next six years, renewables will remain the fastest-growing form of new electricity generation, with their share of generation, reaching almost 28 per cent in 2021 from 23 per cent in 2015. The continuation of supportive policy frameworks as well as new technological breakthroughs will be crucial to continue driving down costs and maintaining deployment momentum. During the forecast period, world renewables output is expected to account for more than 60 per cent of total electricity generation growth on average, yet strong regional differences are evident. Given uncertainties over the projection period, the accelerated case is indicative of the potential upside for annual renewable deployment over the medium term.
[i] https://www.iea.org/newsroom/news/2016/october/iea-raises-its-five-year-renewable-growth-forecast-as-2015-marks-record-year.html
[ii] http://www.ren21.net/Portals/0/documents/activities/Topical%20Reports/REN21_10yr.pdf
[iii] Zhang, Y., Tang, N., Niu, Y. & Du, X. (2016), Wind Energy Rejection in China: Current Status, Reasons and Perspectives, p8.
[iv] National Energy Administration
Related Analysis
Wild Cards: Could these technologies advance the energy transition?
In December 2022, scientists at the National Ignition Facility achieved a landmark nuclear fusion result: a reaction that produced more energy than the laser pulse used to start it. It made headlines globally, but the caveats came quickly. Overall system energy use was still far higher, and commercial viability remains decades away. It was a real breakthrough, but also a reminder of how far the engineering still has to go. That gap between scientific progress and commercial reality is a defining feature of the energy transition today. While solar, wind, and batteries are scaling rapidly and doing most of the heavy lifting, the International Energy Agency estimates that nearly half of the emissions reductions needed for net zero will depend on technologies still at demonstration stage or earlier. This raises the key question: which “wild card” technologies could help close that gap?We take a look.
The ‘f’ word that’s critical to ensuring a successful global energy transition
You might not be aware but there’s a new ‘f’ word being floated in the energy industry. Ok, maybe it’s not that new, but it is becoming increasingly important as the world transitions to a low emissions energy system. That word is flexibility. The concept of flexibility came up time and time again at the recent International Electricity Summit held in in Sendai, Japan, which considered how the energy transition is being navigated globally. Read more
Nuclear Fusion Deals – Based on reality or a dream?
Last week, Italian energy company ENI announced a $1 billion (USD) purchase of electricity from U.S.-based Commonwealth Fusion Systems (CFS), described as the world’s leading commercial fusion energy company and backed by Bill Gates’ Breakthrough Energy Ventures. CFS plans to start building its Arc facility in 2027–28, targeting electricity supply to the grid in the early 2030s. Earlier this year, Google also signed a commercial agreement with CFS. These are considered the world’s first commercial fusion-power deals. While they offer optimism for fusion as a clean, abundant energy source, they also recall decades of “breakthrough” announcements that have yet to deliver practical, grid-ready power. The key question remains: how close is fusion to being not only proven, but scalable and commercially viable, and which projects worldwide are shaping its future?
Send an email with your question or comment, and include your name and a short message and we'll get back to you shortly.