

by Carl Kitchen
Renewable integration: How do we compare?
AEMO recently released an insights paper that looks to assess how Australia compares internationally in efforts to integrate renewables and evaluate approaches used by other countries to see if there are lessons for the National Electricity Market (NEM) and WA’s South West Interconnect System (SWIS)[i].
Its five key findings are outlined below.
At the front of the peleton
Parts of Australia are already at the international forefront with some of the highest levels of wind and solar generation, including one of the highest levels of residential solar PV (20 per cent of homes. The most comparable system internationally for the amount of rooftop solar and impact on the grid is Oahu in Hawaii. Oahu has approximately 32 per cent of households with solar PV.
AEMO notes that interconnected power systems including South Australia have operated for periods where wind and solar output has been larger than demand such as Denmark (157 per cent) and South Australia (142 per cent), while islanded systems, such as Ireland (85 per cent), Tasmania (70 per cent) and Great Britain (67 per cent) have operated with high levels of wind and solar relative to demand.
With electricity demand continually varying, periods of high renewable generation do not always coincide with when the need for electricity is high and as a result it is becoming more common for power systems to operate during periods when the majority of demand is being supplied by variable generation.
How the NEM and SWIS compares internationally with other power systems with high penetrations of wind and solar output is shown in figure 1 below. While figure 2 shows the various components in different power systems internationally compared to the NEM and SWIS.
Figure 1: Large international power systems operating with high instantaneous penetrations of wind and solar generation, and Australian comparisons
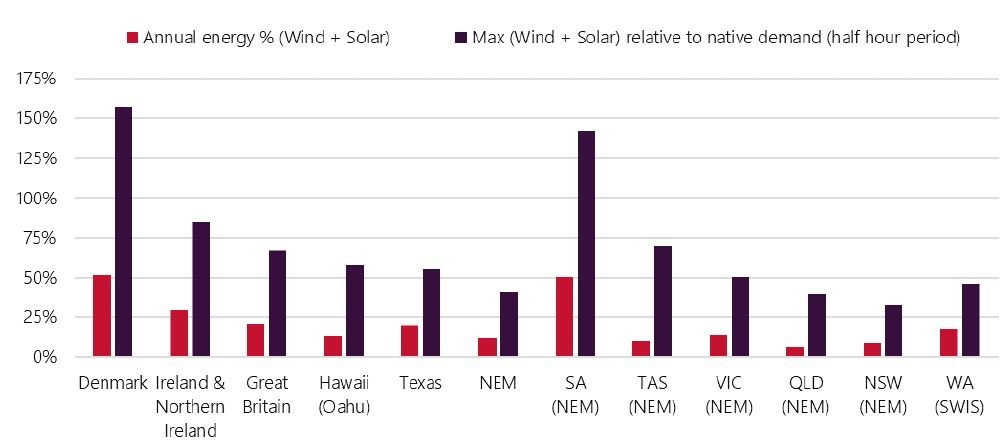
Note: first column shows the proportion of annual energy served by wind and solar for each region and the second shows the period with the maximum percentage of wind and solar relative to demand. Source AEMO Insights
Figure 2: Installed components of large international power systems relative peak demand (*click on graph to view bigger image)
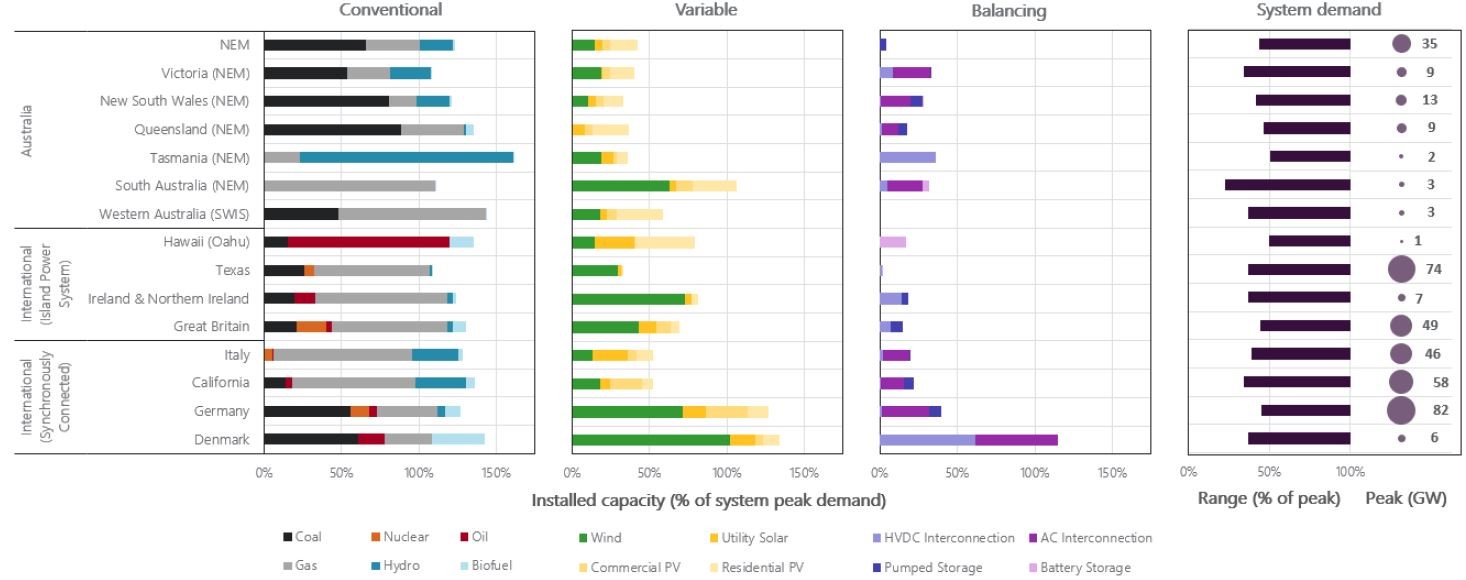
Notes: Installed capacity by fuel type relative to peak system demand is shown in column 1. Column 2 shows installed capacity of variable resources relative to system peak demand. Column 3 shows the amount of storage and interconnection. Column 4 compares the percentage of peak demand high renewable systems identified. Source: AEMO Insights Paper
With each system facing different challenges, a number of factors have to be assessed, including:
- Resource location and network topology.
- System complexity and flexibility
- Coincidence of resource and demand
- Amount of storage and interconnection available
Visibility
AEMO notes that distributed energy resources (DER) continue to grow as homes and businesses introduce solar and battery systems, for example, integrating higher levels will require increasing visibility, predictability and control.
The lack of visibility, the paper says, is an issue because it can impact the system operator’s understanding of their behaviour and then manage the overall power system.
In response, the Electric Reliability Council of Texas (better known as ERCOT) is collecting static information about the DER in its networks and is integrating this into its system modelling. For the NEM new regulations have been introduced which mandate the collection of static device information for all DER and the market operator is developing updated load models.
In contrast other jurisdictions have some level of real-time operational visibility, such as Germany and Italy where 70 per cent of DERs are commercial systems with telemetry for data collection.
In terms of controllability of the power system with passive DER forms of feed-in management over residential solar PV systems has been introduced by system operators in Germany, Japan and Hawaii, but so far these are only intended for isolated emergency situations. AEMO notes that neither the NEM nor the SWIS have any way to actively control residential DER.
With increasing levels of residential rooftop solar some jurisdictions have mandated improved inverter functionality, such as Europe (through the European Network Code for Generators) and California and Hawaii with the requirements of those states now integrated into the US national standard for DER connection in 2018. Similar requirements are now being looked at by AEMO.
Ramping requirements
In response to the increasing challenge of managing power variability as more wind and solar enter the system Ireland and California have implemented ramping constraints. Locally AEMO is undertaking detailed analysis as part of its Renewable Integration Study (RIS) to better understand how ramping challenges are likely to emerge in the NEM.
Hawaii has implemented ramp rate limits for renewable generators while in Denmark a maximum ramp rate is imposed for large-scale wind and solar.
Frequency management
This was identified as a growing issue by Deloitte Access Economics when it assessed the South Australia’s strong growth in renewable generation and noted the “dwindling number of assets” that could provide frequency control[ii]
AEMO’s Insights paper highlights that Texas and Ireland require primary frequency response from both conventional and renewable generators, and the SWIS shares this requirement, while in the NEM a subset of available generation is required to respond.
AEMO’s paper notes that Texas and Ireland have employed inertia requirements that are applicable at all times and Great Britain and Ireland have employed rate of change of frequency (RoCoF) requirements that apply at all times.
A staged approach
The paper points to system operators taking a staged approach to relaxing power system operational limits on the number of synchronous generators online. AEMO has suggested that consideration should be given to how new system conditions can be trialled in the NEM and SWIS.
Next steps
AEMO’s Insights paper will feed into its Renewable Integration Study and it writes that the focus for this work will now be on:
- Quantifying the technical limits of the NEM for projected energy mix and networks in 2025;
- Identifying any ultimate theoretical limits on renewable penetration levels in the NEM
- Identifying potential technology options to enable system operation based on those limits.
- A report on these investigations is expected in the first quarter next year.
[i] Maintaining Power System Security with High Penetrations of Wind and Solar Generation. International Insights for Australia, Australian Energy Market Operator, October 2019.
[ii] Energy Markets and the Implications of Renewables. South Australian Case Study. Deloitte Access Economics, November 2015
Related Analysis
Certificate schemes – good for governments, but what about customers?
Retailer certificate schemes have been growing in popularity in recent years as a policy mechanism to help deliver the energy transition. The report puts forward some recommendations on how to improve the efficiency of these schemes. It also includes a deeper dive into the Victorian Energy Upgrades program and South Australian Retailer Energy Productivity Scheme.
The return of Trump: What does it mean for Australia’s 2035 target?
Donald Trump’s decisive election win has given him a mandate to enact sweeping policy changes, including in the energy sector, potentially altering the US’s energy landscape. His proposals, which include halting offshore wind projects, withdrawing the US from the Paris Climate Agreement and dismantling the Inflation Reduction Act (IRA), could have a knock-on effect across the globe, as countries try to navigate a path towards net zero. So, what are his policies, and what do they mean for Australia’s own emission reduction targets? We take a look.
UK looks to revitalise its offshore wind sector
Last year, the UK’s offshore wind ambitions were setback when its renewable auction – Allocation Round 5 or AR5 – failed to attract any new offshore projects, a first for what had been a successful Contracts for Difference scheme. Now the UK Government has boosted the strike price for its current auction and boosted the overall budget for offshore projects. Will it succeed? We take a look.
Send an email with your question or comment, and include your name and a short message and we'll get back to you shortly.