

by Carl Kitchen
Renewable energy: How does it score?
Both the Clean Energy Council (CEC) and the Climate Council have released reports in recent days highlighting the continued development of renewable generation in Australia.
The CEC’s Clean Energy Australia Report 2015 shows that renewables accounted for 14.6 per cent of Australia’s electricity in 2015 (just over 35,000GWh, of which 15,200GWh of large-scale renewable energy generation counts towards the RET of 33,000GWh). The major contributors were hydro (accounting for 40.1 per cent of renewable energy generated), wind (33.7 per cent) and household and commercial PV (16.2 per cent). Large-scale solar PV contributed 0.6 per cent of renewable generation, or 0.09 per cent of Australia’s electricity. The contribution of each renewable technology is shown in Figure 1.
Figure 1 Estimated contribution of each technology to renewable generation[i]

The CEC notes that the overall renewable energy generation was higher in than 2014, with wind and solar increasing by just over 20 per cent in 2015, enough to more than compensate for a drop in hydro generation.
It also notes that eight large-scale solar projects became operational in 2015 “marking a breakthrough year for this extremely promising technology”. The top five large-scale solar plants were AGL’s Nyngan (102MW) and Broken Hill (53MW) plants (both in New South Wales), Royalla (20MW) in the ACT, Greenough River (10MW) in WA and Liddell III (9.3MW) in NSW. Penetration of renewables by state is shown in Figure 2.
Figure 2[ii]
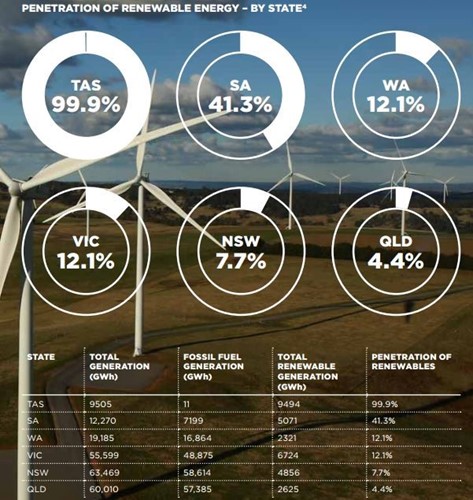
Source: Clean Energy Australia Report 2015. 4: Total generation figures include data from National Electricity Market, the West Australian wholesale electricity market and solar PV. The ACT is part of the NSW region and there is no data for the small NT grid. Some of the Snowy Hydro scheme in NSW is counted as Victorian generation by AEMO. These figures are not the same as the total electricity generation, as non-scheduled and off-grid generation are not included in this data (other than domestic solar). Source: NEM Watch, SunWiz.
Looking forward, to meet the Renewable Energy Target (RET) the report says that between 30 and 50 large-scale wind and solar projects need to be built by 2020, and that the 33,000GWh goal could either be met by around 6,000MW of wind or 12,000MW of solar power, with a mix of these expected (along with other renewable technologies, such as hydro, bioenergy and wave/tidal power). Already more than 8,000MW of wind and 2,500MW of solar projects are under construction or have planning approval, it notes, with this pipeline of projects expected to be enough to meet the RET[iii].
State Initiatives on Renewables
Both the CEC and the Climate Council have pointed to state and territory measures to encourage renewable energy development. The Climate Council argues that governments at state, regional and local levels are playing an increasingly important role in growing renewable power with the number of Australian states with their own RETs increasing from two to four in the previous 12 months – ACT (100 per cent by 2020), South Australia (50 per cent by 2025), Victoria (at least 20 per cent by 2020) and Queensland (50 per cent by 2030).
The Climate Council's contribution to considering the approach of states and territories to renewables development has been to produce a scorecard to try to compare state-by-state performance. The scorecard uses a subjective formula – scoring the percentage of renewables, a per capita large scale renewables (wind farms, hydro and solar), the proportion of solar households, as well as ranking government policy settings and state-based renewable energy targets – to establish performance and a final grading. The approach leads to some anomalies. For example, Tasmania sources by far the most renewables of any state (95 per cent according to the council’s report and 99.9 per cent according to the CEC’s 2015 report), and has the second highest capacity per capita of large-scale renewable energy capacity installed (excluding hydro)[iv], but it is only ranked as B grade. The large discrepancy in renewable energy generation in Tasmania reported by the CEC and the Climate Council is unexplained. However, analysis from the Australian Energy Council suggests that 99.9 per cent is the correct figure.
Tasmania has been marked down because it does not have a renewables target, despite already sourcing most of its electricity supply from hydro, and has a lower number of households with solar PV. As highlighted in the Australian Energy Council’s March 2016 solar report the payback period for residential solar PV in Hobart (based on the 10 year average home loan rate) is the highest amongst the states. The payback period for many large system sizes, including 4kW and 5kW, exceeds 25 years. Even 1.5kW and 2kW systems have a payback period of more than 17 years, while 3kW systems have a payback period of around 23 years. Such long payback periods make solar PV a less attractive proposition for households in Tasmania. The payback periods are shown in Figure 3.
Figure 3: Payback period for solar PV (7.02 per cent discount rate)
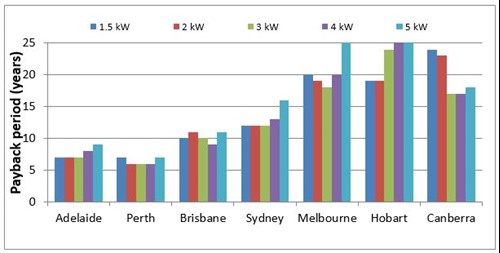
Source: Australian Energy Council, Solar Report March 2016
While the scorecard notes that there is a lack of comparable data on the percentage of renewable energy in the electricity supply for the territories and does not give them a grade (A, B, C), the report does include the ACT in its “leading the pack” grouping elsewhere in the report, along with South Australia and Tasmania. While the Northern Territory, is reported as “lagging behind”. The ACT is a part of the NSW grid and is meeting its 100 per cent renewable energy through funding of renewable projects elsewhere in the NEM, which makes it extremely problematic to compare with other jurisdictions such as those listed below. The Climate Council’s scorecard is shown below[v] in Table 1.
Table 1: The Australian Renewable Energy Race: 2016 Scorecard
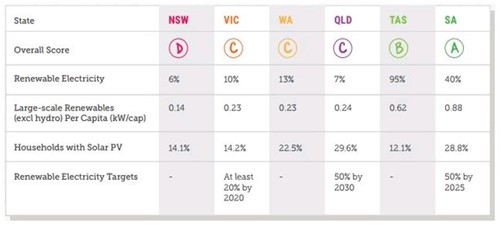
Source: Climate Council
The inclusion of renewable energy targets is not necessarily meaningful either, regardless of whether they represent good policy. Queensland and Victoria are currently going through the process of determining what their proposed targets mean in practice, while although South Australia’s is well established, it has effectively relied on the Commonwealth’s renewable energy subsidies to drive investment in SA.
Integration of Renewables
Neither report considers the increasing challenge of integrating more intermittent generation into the electricity grid. The Climate Council simply comments that as Australia faces up to delivering deep cuts to emissions through increased renewables, “it is no surprise that increased grid inter-connectivity and storage will be needed”. It also notes that South Australia’s ability to add more renewable capacity and export surplus power interstate, as well as import power when the wind isn’t blowing and the sun isn’t shining, is being adversely affected by the limited size of the interconnector with Victoria. The council argues that there are “compelling” reasons to urgently investigate a new interconnector between SA and NSW. A new interconnector, it writes, would increase competition in wholesale markets in three states (SA, NSW, Vic), improve supply security and reduce the carbon intensity of the National Electricity Market. This analysis overlooks several factors, including that there are already two routes open to proponents of new interconnectors (a market asset route, where the owner takes the risk on how much revenue they can earn from facilitating interregional trade, and a regulated asset route, where the proponent simply has to demonstrate a net benefit and they can then earn a guaranteed income). It also overstates the value of “increasing” competition in an already highly competitive market.
Renewables Jobs
Lastly, in assessing jobs in the renewable industry, the CEC reports that there has been a 27 per cent fall in employment from the peak of 2011-12 (19,120) to 2014-15 (14,020). The CEC comments that the mood across the renewable industry is upbeat in 2016, and it expects that job numbers will begin to grow as projects are developed under the RET in coming years. The Climate Council points to accelerated renewable energy deployment creating jobs across a broad range of activaties including planning, construction, manufacturing, operations and maintenance. It argues that a doubling of renewable correlates with even more jobs being created even taking jobs losses in fossil fuels into account.
Renewable energy deployment programs often create jobs that are largely during the construction phase and hence do not extend into ongoing positions. Australian Bureau of Statistics (ABS) figures show that the large bulk of the jobs in the sector are in rooftop PV installation[vi] (which includes solar hot water systems) with total direct annual FTEs in 2014-15 of 7,480 or 53 per cent of all employment. The ABS notes that while employment in this category fluctuated from 2009-10 to 2014-15, it remained the largest single contributor to employment in renewable energy activities throughout the period. It peaked in 2011-12 when employment in roof-top solar PV made up 75 per cent of total direct FTE renewable jobs.
Employment in wind power is primarily driven by installation activity, rather than by ongoing operation and maintenance and as the ABS[vii] notes: “As a result, this employment is heavily dependent on continuing formation of wind power infrastructure and is relatively volatile.”
[i] Clean Energy Australia Report 2015, page 4.
[ii] ibid, page 7.
[iii] ibid, page 4.
[iv] Game On. The Australian Renewable Energy Race Heats Up, Climate Council May 2016
[v] ibid, page 3
[vi] Employment in Renewable Energy Activities, Australia, 2014-15, ABS
[vii] Ibid
Related Analysis
Certificate schemes – good for governments, but what about customers?
Retailer certificate schemes have been growing in popularity in recent years as a policy mechanism to help deliver the energy transition. The report puts forward some recommendations on how to improve the efficiency of these schemes. It also includes a deeper dive into the Victorian Energy Upgrades program and South Australian Retailer Energy Productivity Scheme.
2025 Election: A tale of two campaigns
The election has been called and the campaigning has started in earnest. With both major parties proposing a markedly different path to deliver the energy transition and to reach net zero, we take a look at what sits beneath the big headlines and analyse how the current Labor Government is tracking towards its targets, and how a potential future Coalition Government might deliver on their commitments.
The return of Trump: What does it mean for Australia’s 2035 target?
Donald Trump’s decisive election win has given him a mandate to enact sweeping policy changes, including in the energy sector, potentially altering the US’s energy landscape. His proposals, which include halting offshore wind projects, withdrawing the US from the Paris Climate Agreement and dismantling the Inflation Reduction Act (IRA), could have a knock-on effect across the globe, as countries try to navigate a path towards net zero. So, what are his policies, and what do they mean for Australia’s own emission reduction targets? We take a look.
Send an email with your question or comment, and include your name and a short message and we'll get back to you shortly.