
by Australian Energy Council
Outlook highlights challenges and change
The latest US Energy Information Administration (EIA) annual energy outlook provides a useful insight into the shifts in both the drivers of electricity consumption and the anticipated transition in the generation sources.
Of note is the anticipated ongoing significant role for gas both for generation and industrial uses out to 2050, given the US domestic supplies of gas. But this is likely to continue to make the path to the US Administration’s overall emission reduction targets challenging.
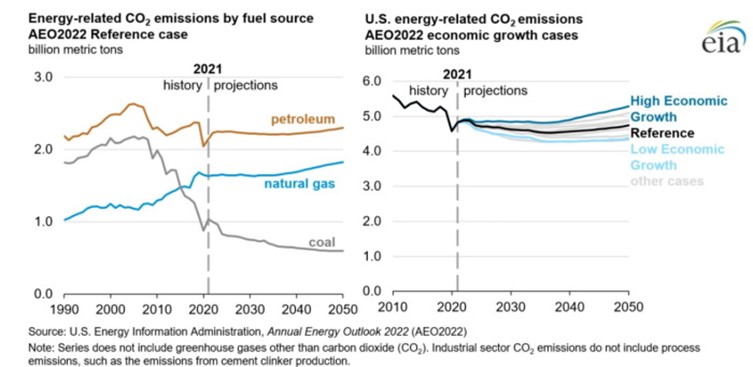
The EIA annual energy outlook 2050 forecasts that while energy-related carbon emissions will dip through to 2035 they will climb again in the later years. Emissions fall from this year helped by shifts from coal generation to more gas-fired generation and renewable energy sources and as a result of a decrease in the US economy’s overall energy intensity. But after 2037 carbon emissions increase as a result of increasing energy consumption due to population growth as well as economic growth that will outweigh gains in energy efficiency, with gas and petroleum use the major contributors (see figure 1).
Figure 1: Emissions by Fuel Type and Economic Outlook
Electricity Use
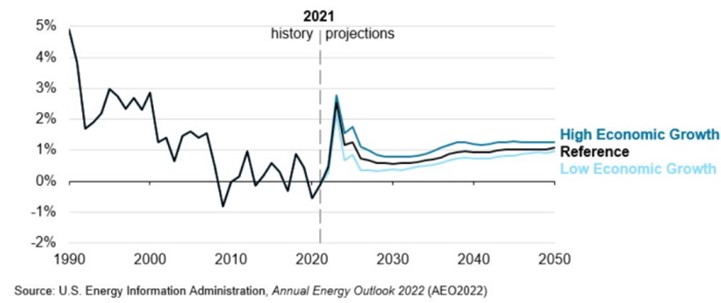
In terms of electricity consumption, the three-year rolling average growth is expected to peak next year, and in its reference case the EIA forecasts average annual growth of more than 1 per cent won’t occur until near the end of the projection period.
Figure 1: Electricity Consumption by Scenario
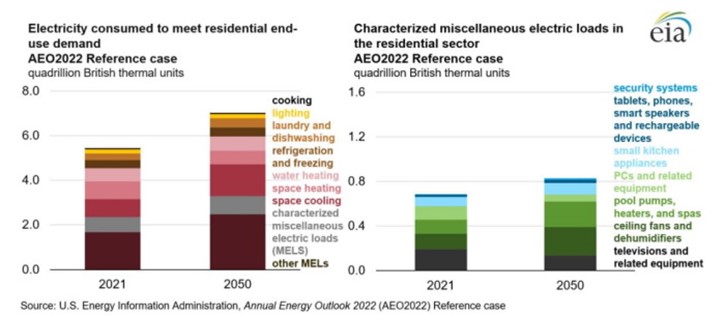
But electricity use in US homes is expected to grow 22 per cent between now and 2050, while electricity from onsite sources, like rooftop solar, grows at an average annual rate of 6.1 per cent. Solar PV is forecast to increase to supply 8 per cent of the electricity used in homes and 6 per cent of the electricity consumed in commercial buildings in 2050. Electricity is expected to continue to be the fastest growing source of energy in buildings despite improvements in the efficiency of lighting and air conditioning and other end uses. Major contributors of demand in homes is increasing cooling demand, which is expected to rise by 77 per cent to 2050, as well as households’ love of devices like smartphones, televisions, personal computers and tablets (categorised as miscellaneous electric loads, or MELs) helps drive electricity demand. Electricity used for MELs is expected to increase 20 per cent by 2050. In particular in this category electricity to charge tablets is expected to increase and the electricity usage increase to charge smartphones grows faster than population growth with the average number of these phones per household rising 8 per cent between 2021 and 2050 - this is on top of already substantial penetration (72.7 per cent of the population in 2021, according to Statista.
Figure 2: Residential Electricity Consumption in the Home
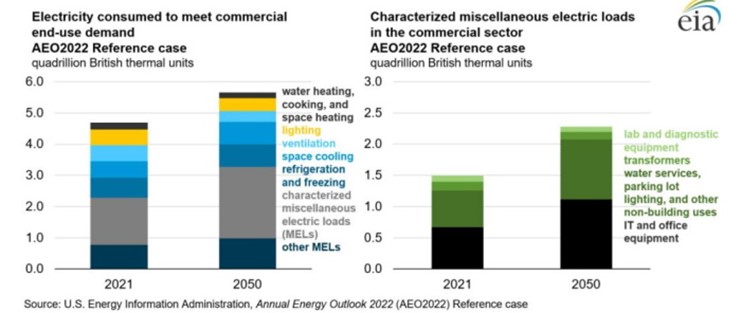
In commercial buildings, electricity for air conditioning will increase 38 per cent over the forecast period and MELs will consume an extra 29 per cent of electricity in 2050 compared to today. Consumption by data centres in commercial buildings will grow and as part of this energy used by commercial IT and office equipment is expected to jump by 67 per cent.
Figure 3: Commercial Building Electricity Use
Demand for electricity is expected to grow fastest in the transport sector as a result of the shift to electric and hybrid vehicles, but it still remains less than 3 per cent of economy-wide electricity use over the forecast period. Electric vehicles (EV) increase from less than 1 per cent of cars to just over 7 per cent of the on-road light vehicles. Internal combustion engine vehicles will remain dominant over the forecast period although they do decrease from 92 per cent of vehicle sales last year to 79 per cent in 2050 as more EVs, hybrid and plug-in hybrid vehicles (PHEVs) hit the roads. Total EVs share of on-road cars are expected to grow from less than 3 per cent to 13 per cent in 2050. The increased electrification of vehicles on the road will increase electricity consumption for transport from less than 0.5 per cent to more than 2 per cent.
Generation Changes
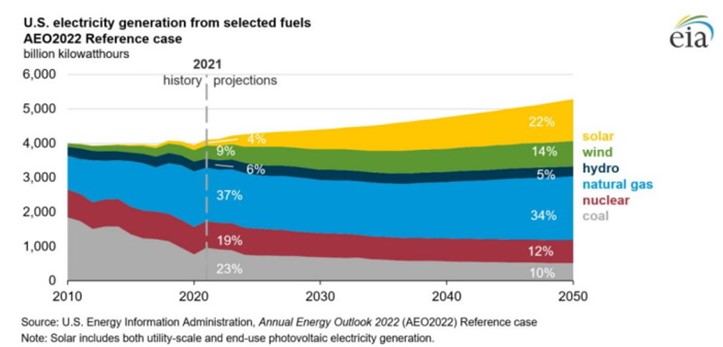
Supportive policies in both state and federal jurisdictions for wind and solar, as well as falling technology costs, are expected to increase renewables competitiveness in the generation mix, while the shares of coal and nuclear power will fall.
Growth for wind and solar generation is substantial and is forecast to increase more rapidly than overall electricity demand throughout the period. Wind increases from 9 per cent of the generation mix now to 14 per cent in 2050 and solar’s electricity generation contribution jumps from 4 per cent to 22 per cent. The share of electricity generation from gas plants is anticipated to fall from 37 per cent to 34 per cent, coal’s share is expected to be less than half (down from 23 per cent down to 10 per cent) and nuclear’s contribution dips by 7 per cent to 12 per cent in 2050.
Despite these falls the analysis also indicates that traditional generation from gas, nuclear and coal plants combined is expected to continue to supply the majority (56 per cent) of electricity in 2050. (see figure 4).
Figure 4: Projected changes in Generation by Type 2021-2050
Renewable contributions
Renewable generation is expected to account for well over half the 1000GW of cumulative capacity that will be added in the reference case through to 2050, driven by falling costs and support measures like state-based renewable targets and federal and state tax credits.
Wind is expected to be the strongest growing renewable over the next two years, accounting for more than two thirds of renewable generation, largely driven by production tax credits which phase out at the end of 2024. Solar then is expected to account for nearly 75 per cent of the increase in renewable and account for nearly half of generation capacity additions to 2050 (compared to 10 per cent for wind).
The EIA expects sustained low natural gas prices to keep natural gas generation’s share constant at about a third of the generation mix through to 2050, particularly as coal and nuclear generation retires. Renewables are anticipated to account for the gap in generation over the period.
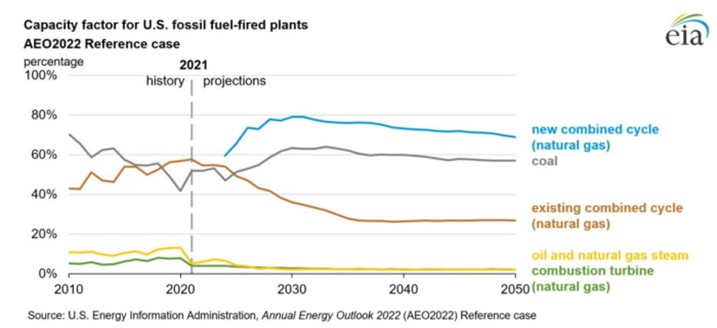
The growth in renewables is also expected to lead to a substantial fall in the capacity factor for combined-cycle gas plants (down by nearly half from a peak of 60 per cent in 2020). Gas plants are forecast to account for 39 per cent of cumulative capacity increases through to 2050, with more than half of this being peaking gas plants, which can complement renewable generation. These gas plants will face competition from stand-alone batteries and solar-battery hybrid systems as backup for variable renewables
In contrast to CCGT plants, the average capacity factor for remaining coal units are expected to grow as older plant retires and the remaining coal fleet is made up of more efficient and cost competitive units.
Figure 5: Changes in Plant Capacity Factors
Related Analysis
Consumer Energy Resources: The next big thing?
The Consumer Energy Resources Roadmap has just been endorsed by Energy and Climate Change Ministers. It is considered by government to be the next big reform for the energy system and important to achieving the AEMO’s Integrated System Plan (ISP). Energy Minister, Chris Bowen, recognises the key will be “making sure that those consumers who have solar panels or a battery or an electric vehicle are able to get maximum benefit out of it for themselves and also for the grid”. There’s no doubt that will be important; equally there is no doubt that it is not simple to achieve, nor a certainty. With the grid intended to serve customers, not the other way around, customer interests will need to be front and centre as the roadmap is rolled out. We take a look.
Australia’s workforce shortage: A potential obstacle on the road to net zero
Australia is no stranger to ambitious climate policies. In 2022, the Labor party campaigned on transitioning Australia’s grid to 82 per cent renewable energy by 2030, and earlier this year, Prime Minister Anthony Albanese unveiled the Future Made in Australia agenda, a project which aims to create new jobs and opportunities as we move towards a net zero future. While these policies have unveiled a raft of opportunities, they have also highlighted a major problem: a lack of skilled workers. Why is this a problem? We take a closer look.
Made in Australia: The Solar Challenge
While Australia is seeking to support a domestic solar industry through policy measures one constant question is how Australia can hope to compete with China? Australia currently manufactures around one per cent of the solar panels installed across the country. Recent reports and analysis highlight the scale of the challenge in trying to develop homegrown solar manufacturing, as does the example of the US, which has been looking to support its own capabilities while introducing measures to also restrict Chinese imports. We take a look.
Send an email with your question or comment, and include your name and a short message and we'll get back to you shortly.