

by Carl Kitchen
New NEM records set
New records for negative and zero price periods in the National Electricity Market (NEM) continue to be set.
The Australian Energy Market Operator’s (AEMO) most recent assessment, Quarterly Energy Dynamics Q3 2021, shows negative and zero prices across the NEM occurred 16 per cent of the time - more than double the previous record of 7 per cent set in the last quarter of 2020.
There were records in all regions including New South Wales, where negative spot prices occurred in 5 per cent of the trading periods - previously negative prices have been rare for that state. While the number of negative price intervals were up substantially across all regions, southern regions led the way with South Australia reporting negative spot prices for a quarter of the time, Victoria (21 per cent) and Tasmania (19 per cent).
In Victoria, the increased periods of negative prices meant the average price between 10am and 3:30pm was just $0.01/MWh in August and September. Queensland had negative spot prices 10 per cent of the time during the quarter.
Figure 1: Occurrence of negative prices by region (%)
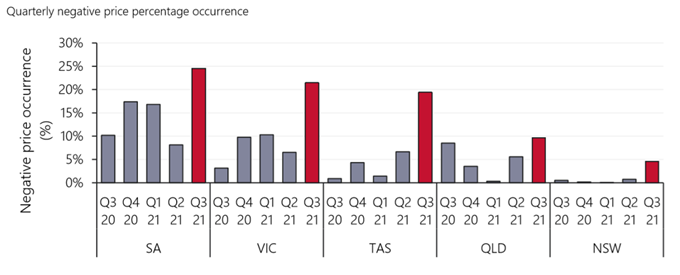
Source: Quarterly Energy Dynamics Q3 2021
The coincidence of negative price periods meant a mainland NEM record was also set in the quarter: All four regions had negative prices at the same time nearly 4 per cent of the time (well above the previous record of 0.7 per cent of the time which was set in the previous quarter).
Price volatility and higher prices were largely limited to July with prices in all regions falling away significantly in August and September (see figure 2).
Figure 2: Mainland NEM average spot price by time of day, Q3 2021 (monthly) vs Q3 2020
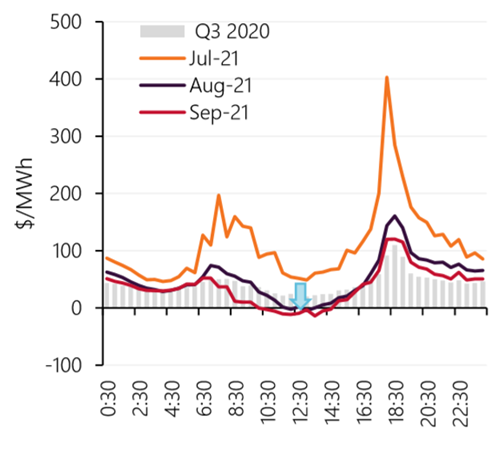
Source: Quarterly Energy Dynamics Q3 2021
South Australia experienced the most noticeable impact on average spot prices during the quarter, where negative prices saw the average price cut by $10.20/MWh. In Victoria average spot prices for the quarter were cut by $4.50/MWh while in Tasmania the average spot price was cut by $2.40/MWh in Q3.
Key factors
After July during the quarter prices head towards zero in the middle of the day due to peak solar output – both large-scale and rooftop – as well as milder weather and lower operational demand. In particular, New South Wales demand was 359 MW lower compared to August-September 2020 due to these factors.
For Queensland, as well as New South Wales, low midday demand due to rooftop solar and high solar farm output played key parts. Combined solar farm generation in the two regions was above 2000MW between 9am and 3:30pm 38 per cent of the time. In contrast this occurred only 2 per cent of the time in the previous corresponding period.
South Australia and Victoria had an increase in negative price periods when there was very high renewable generation available, especially from wind farms because of new installed capacity and windy conditions. The high levels of wind generation and low overnight and midday demand (driven by the availability of solar generation) were key factors in the increased negative prices during these periods.
In Tasmania increased rainfall was a key factor supporting 380MW more hydro generation being offered below $0/MWh than in the same period in 2020. The state also had more wind generation (up 56MW) available, increased exports via the Basslink interconnector and more frequent “interconnector binding”, which contributed to its negative price periods.
Figure 3 shows negative price occurrence by region during the period with most in the middle of the day, and some periods overnight in the southern states of the NEM.
Figure 3: Negative spot price occurrence
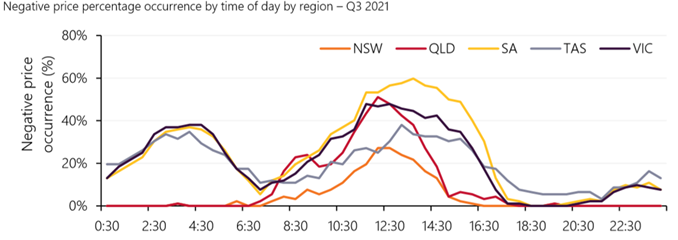
Source: Quarterly Energy Dynamics Q3 2021
The response
AEMO’s analysis shows a substantial increase in responses to prices from utility scale wind and solar with the deployment of automated bidding software and following high levels of negative prices in past quarters. This saw four and a half times the number of rebids by wind and solar farms compared to the same quarter 2020. Around 45 per cent of New South Wales’s semi-scheduled renewable generating capacity has automated bidding and AEMO reports there was an 11-fold jump in rebids for the region compared to last year.
It seems likely this increase was initiated by changes to the rules on dispatch compliance by semi-scheduled generators that came into effect on 12 April 2021, mid-way through Q2 2021. This rule prohibits these generators from intentionally producing below their dispatch target. It is common for them to offer all their output at the market floor price to maximise output in the presence of local network congestion, however this also means their dispatch target will stay high during severe negative prices. In order to minimise their exposure to this price, the rule now requires the generator to first rebid before reducing output.
Figure 4: Increase in rebidding by renewable generators
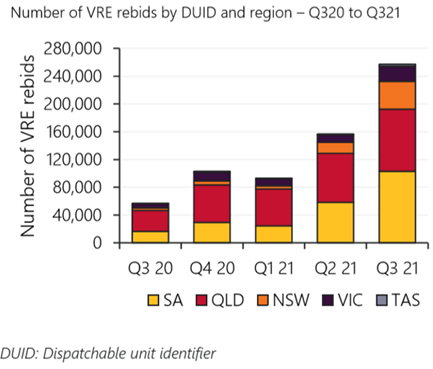
Source: Quarterly Energy Dynamics Q3 2021
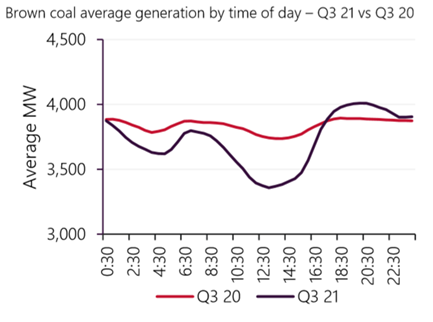
Brown coal generators have also had to respond to low or negative prices by moving marginal capacity to higher price bands ($10/MWh to $35/MWh) during low or negative spot price periods in Victoria. Average brown coal output was 332MW lower between 10am and 4pm this quarter compared to the corresponding period in 2020.
Figure 5: Brown coal output
Source: Quarterly Energy Dynamics Q3 2021
Constraints
New renewable capacity over the past year, windy conditions as well as the ramping up of capacity that had been in commissioning phase in the corresponding quarter last year were the key reasons for a record average of 3984MW of renewable generation, up 828MW from Q3 2020 and the biggest quarter on quarter increase reported. This, along with the continued installation of rooftop solar in the NEM, led to new highs for renewable generation in the overall energy mix. The record for renewable share of NEM generation was broken several times and set a new high mark of 61.4 per cent for the half hour up to 1:30pm on 24 September. The average share of generation for renewables over the quarter was 31.7 per cent, another record.
The high renewable generation driven by seasonally higher wind and solar output as well as increased renewable capacity, also led to a record level of constrained curtailment of output from grid-scale solar and wind which reached 351MW for the quarter – the average in the previous quarter was 118MW while it was 187MW in Q3 2020. Curtailment increased in all mainland NEM regions. The constrained output was the result of factors including responses from market participants, and the need to manage system security and network congestion.
Economic curtailment increased by 115MW (up from 53 MW in Q2 2021 to 168 MW) – led by Victoria (up 44 MW) and South Australia (up 39 MW). Curtailment to manage system strength was highest in South Australia (62MW), while there was an average curtailment of 38MW in NSW and Victoria because of transmission outages in the West Murray area. Increased solar generation with new solar farms in New South Wales led to curtailment due to network constraints (up to 31 MW) for that region, with smaller rises in other network-related curtailment in South Australia and Queensland.
Robbing solar Peter to pay solar Paul
The extended periods of negative prices economic curtailment during the daylight hours of Q3 is symptomatic of a new paradigm in the NEM: long periods when the power system’s marginal generator is variable renewable energy (VRE). At these times, fossil fuel and hydro plants have all reduced either to zero, or to their minimum stable outputs (coal plants need to stay on-line at this level so they can be ready to pick up when the sun goes down).
This surplus of supply can only be managed by wind and solar “spilling” - intentionally reducing output, despite their fuel supply being free and limitless. Because they typically bid at a negative price, this sets a negative price for the market. This is an intentional market outcome in these conditions.
These negative prices will affect the business case for building more large-scale solar, i.e. the prices correctly signal that the NEM has saturated with this technology. However features of network and retail pricing, combined with federal and state subsidies, inhibit the sending of this important signal to rooftop solar, which continues to be installed at extraordinary rates.
Importantly, new rooftop solar being installed in Australia is not creating the emissions benefit it once was. This is because for most of the time when it generates, there is no longer any opportunity for its output to displace fossil fuels. Instead, its output is simply displacing large-scale renewable energy, effectively robbing solar Peter to pay solar Paul. Governments therefore should reconsider the previously assumed environmental benefit of rooftop PV.
Related Analysis
Ireland’s Green Energy Rule: What Can Australia Learn From Its Approach to Data Centres?
A recurring theme at the Australian Energy Council’s inaugural Energy2050 Conference was the challenge of managing the rapid growth of data centres and their increasing electricity demand. While data centres present a significant economic opportunity for Australia, policymakers are grappling with how to support investment while minimising impacts on customers, the electricity system, and emissions. We take a look at Ireland’s recently introduced data centre policy and explore the lessons it may offer for Australia.
Retail protection reviews – A view from the frontline
The Australian Energy Regulator (AER) and the Essential Services Commission (ESC) have released separate papers to review and consult on changes to their respective regulation around payment difficulty. Many elements of the proposed changes focus on the interactions between an energy retailer’s call-centre and their hardship customers, we visited one of these call centres to understand how these frameworks are implemented in practice. Drawing on this experience, we take a look at the reviews that are underway.
Data Centres and Energy Demand – What’s Needed?
The growth in data centres brings with it increased energy demands and as a result the use of power has become the number one issue for their operators globally. Australia is seen as a country that will continue to see growth in data centres and Morgan Stanley Research has taken a detailed look at both the anticipated growth in data centres in Australia and what it might mean for our grid. We take a closer look.
Send an email with your question or comment, and include your name and a short message and we'll get back to you shortly.