
by Carol Tran & Carl Kitchen
NEM generation: Stepping on the gas?
Output from gas-fired power stations in the National Electricity Market (NEM) increased by 32.3 per cent during 2017, as it largely filled the baseload gap left by the recent closure of coal-fired plants in South Australia and Victoria. We take a look below at the level of gas generation in the NEM.
South Australia
Based on NEM Review annual data the increased reliance on gas generation has been particularly noticeable in South Australia. Total gas generation in South Australia was 4720GWh in 2017, representing 59.6 per cent of total generation in the state (excluding rooftop solar).
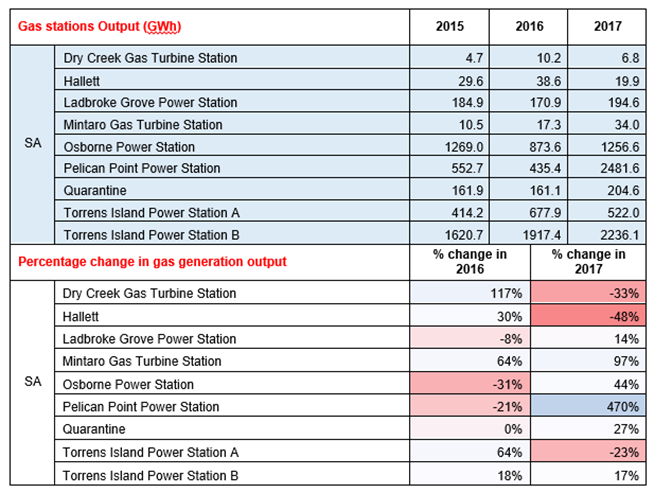
Last year output from Pelican Point was up 470 per cent (2481GWh) while the Osborne power station increased its electricity generation by 44 per cent to 1256GWh in 2017 (see figure 1). Pelican Point’s operating hours increased to 87 per cent of the time compared to 30 per cent a year earlier. Operating hours at Osborne Power Station were also significantly higher in 2017.
SA’s gas generation has increased from 39.4 per cent of its energy mix in 2015, prior to the closure of the 520MW Northern coal-fired power station in May 2016. At the same time wind generation capacity in the state increased 22.5 per cent to 1806MW in the period from 2015-2017, while wind output was 10.6 per cent higher in 2017 (3567GWh).
The Pelican Point power station returned to its full 479MW capacity in mid-2017 after owner ENGIE secured gas supply and signed electricity offtake agreements with a number of customers, including arrangements with Origin Energy to provide gas to help underpin the operation of the capacity of the station’s turbines[i]. The plant had effectively been operating at half capacity since March 2013 due to over-capacity in South Australia.
The Torrens Island A power station reduced its output by 23 per cent in 2017, but its 522GWh of generation was still 108GWh higher than the electricity it produced in 2015. Two of the four Torrens Island A units are to be replaced by a new 210MW gas-fired plant at Barker Inlet. The 50-year old Torrens A plant is expected to be progressively mothballed from July next year. The four Torrens Island B gas turbines will continue to operate[ii]. Last year Torrens B generated 2236GWh, a 17 per cent increase on its 2016 output.
The Quarantine gas-fired peaking plant produced 204GWh of electricity in 2017. Origin Energy is proposing to increase the capacity of the 224MW open cycle gas plant by 160-180MW and has cited the need to support SA’s supply variability due to the high levels of renewables in the state.[iii]
Figure 1 South Australia Gas Generation Data
Source: NEM Review; AEC analysis
Victoria
Gas-fired generators also increased their contribution to Victoria’s power supply in 2017, reaching 6.96 per cent of total generation, up from 1.68 per cent the year before. This reflects the reduced baseload supply available with the withdrawal of the 1600MW Hazelwood power station in March 2017. Prior to its closure Hazelwood generated 2380GWh of electricity in the first quarter of 2017.
The output from the 550MW gas-fired Mortlake Power Station increased to 1646GWh during 2017 (up 293 per cent from the 418.9GWh generated in 2016) while output from the Newport gas-fired plant increased 328 per cent to 881GWh. During 2017 Mortlake’s operating hours were 57.7 per cent compared to 19.4 per cent in 2016, while Newport operated for 32.6 per cent of the time, up from 9 per cent a year earlier.
Smaller gas peaking plants at Bairnsdale, Laverton, Somerton and Jeeralang power plants also contributed additional generation.
Queensland
In Queensland gas generation represented 12 per cent of the state’s total generation (excluding rooftop solar) energy mix, producing 6349GWh of electricity.
Gas-fired generation in Queensland has actually fallen since 2015. Gas plants produced 10,060GWh of electricity in 2015, and this fell to 7106GWh in 2016.
The previous higher levels of gas-fired generation would have been encouraged by a temporary drop in gas prices at the end of 2014 because of the availability of cheap ramp gas. Ramp gas is produced as CSG wells are de-watered in advance of optimal gas production for LNG plants. The increased CSG well development was supported by the development of Queensland’s three LNG projects - Curtis Island which started operating in December 2014, Gladstone LNG which began production in September 2015, and Australian Pacific LNG which began production in December 2015. It was also reported that the temporary gas surplus from this ramp gas was exacerbated by a delay in the start-up of QCLNG, which was originally slated for the first half[iv] of 2014. The removal of the gas oversupply is reflected in the Australian Bureau of Statistic’s gas price index for the east coast gas market which was 97 for the September 2015 quarter and increased to 122.8 in the March 2017 quarter.
NSW
Gas generation provided 4.5 per cent of NSW’s total generation in 2017, which compares to 4.1 per cent a year earlier and 6.3 per cent in 2015.
Tallawarra CCGT power station south of Wollongong NSW almost doubled its generation in 2017 (1629GWh), although this was below its output in 2015 when it produced 2477GWh. Output from other gas fired plants in the state fell during 2017 also. Overall gas generation in NSW was 2881.9GWh in 2017, which compares to 3836.9GWh in 2015 and 2510.3GWh.
The higher gas contribution in 2015 coincided with reduced coal-fired output from the Mt Piper, Eraring, Liddell and the Redbank and Wallerang power stations. In 2015 EnergyAustralia’s parent CLP Group reported that its Mt Piper black coal-fired power station operated at reduced capacity (it generated 5.22TWh, compared to 6.98TWh in 2017) during the year because of uncertainty surrounding ongoing coal supplies. Wallerawang and Redbank power stations were closed at the end of 2014.
Tasmania
In Tasmania generation from the Tamar Valley CCGT plant increased 96 per cent in 2017. Gas generation in Tasmania has increased from 1620GWh in 2015 to 3294GWh in 2017.
In September Hydro Tasmania announced that it would operate the 208MW CCGT plant[v]. The plant was previously brought back into service in December 2015 during Tasmania’s energy issues resulting from the loss of Basslink and low hydro dam levels.
Full details on power plant generation, hours of operation and change in annual output can be found here.
[i] https://www.originenergy.com.au/about/investors-media/media-centre/origin-works-with-engie-to-help-boost-energy-security-in-south-australia.html; http://www.engie.com.au/media/UploadedDocuments/News/Pelican%20Point%20return%20to%20service%20-%20media%20release.pdf
[ii] https://www.agl.com.au/about-agl/media-centre/asx-and-media-releases/2018/february/agl-begins-construction-of-$295-million-barker-inlet-power-station
[iii] https://saplanningcommission.sa.gov.au/__data/assets/pdf_file/0019/420805/Application_documents_-_Origin_QPSX_-_010_V007_18_-_2895.pdf
[iv] http://www.smh.com.au/business/mining-and-resources/brisbane-spot-gas-price-hits-record-low-near-zero-20141002-10pckw.html
[v] https://www.hydro.com.au/news/media-releases/2017/09/14/routine-ccgt-operation
Related Analysis
2025 Election: A tale of two campaigns
The election has been called and the campaigning has started in earnest. With both major parties proposing a markedly different path to deliver the energy transition and to reach net zero, we take a look at what sits beneath the big headlines and analyse how the current Labor Government is tracking towards its targets, and how a potential future Coalition Government might deliver on their commitments.
Retail protection reviews – A view from the frontline
The Australian Energy Regulator (AER) and the Essential Services Commission (ESC) have released separate papers to review and consult on changes to their respective regulation around payment difficulty. Many elements of the proposed changes focus on the interactions between an energy retailer’s call-centre and their hardship customers, we visited one of these call centres to understand how these frameworks are implemented in practice. Drawing on this experience, we take a look at the reviews that are underway.
Data Centres and Energy Demand – What’s Needed?
The growth in data centres brings with it increased energy demands and as a result the use of power has become the number one issue for their operators globally. Australia is seen as a country that will continue to see growth in data centres and Morgan Stanley Research has taken a detailed look at both the anticipated growth in data centres in Australia and what it might mean for our grid. We take a closer look.
Send an email with your question or comment, and include your name and a short message and we'll get back to you shortly.