

by Carl Kitchen
Negative price records set
Parts of the National Electricity Market (NEM) have had record levels of negative electricity prices, and lower spot prices, while ASX electricity futures continued to rise in the third quarter.
The increase in negative pricing periods has been noted previously[i], but the latest quarterly energy dynamics[ii] assessment by Australian Energy Market Operator (AEMO) shows record levels of negative electricity prices in Queensland and South Australia.
Queensland factors
AEMO cites the key factors for Queensland as being:
- Seasonally low (and falling) daytime demand, which is demand between 9 in the morning and 3pm. The third quarter is typically Queensland’s lowest demand quarter with milder winter conditions limiting heating needs;
- The state has also seen increasing amounts of rooftop solar, which pushes down operational demand during the day. In the third quarter average daytime operational demand was about 260MW lower than the previous corresponding period;
- Increased grid-scale solar capacity (1250MW) and extra installed wind generation (500MW) commenced operation between July 2018 and September 2019. The additional generation saw the average daytime contribution from renewable generation increase by about 600MW in August and September this year, compared to the same months a year earlier;
- Interconnector constraints and outages. Low operational demand and high solar output meant excess Queensland supply and several trading intervals reaching prices below -400/MWh. Overall this contributed more than 50 per cent of the negative price impact during the third quarter; and,
- A voltage constraint introduced early this year also meant output from the Sapphire Wind Farm limits flows to NSW on the Queensland to NSW interconnector (QNI).
South Australian factors
In South Australia the key factors impacting prices were a combination of:
- High renewable output with around 54 per cent of the negative intervals during the quarter occurring when SA renewable generation exceeded 1100MW;
- Interconnector constraints – 66 per cent of the negative intervals over the quarter occurred when the Heywood interconnector’s import limit was below 300MW, including periods when AEMO invoked discretionary constraints[iii] to limit transfer on the Victorian-South Australian interconnectors because of the increased risk of credible contingencies in SA and or Victoria associated with “abnormal” weather conditions; and,
- Low operational demand.
The price trends for Queensland and South Australia can be seen in figures 1, 2 and 3 below which highlight the increase in number of negative price periods. Figure 1 highlights the increasing periods since 2017.
Figure 1: Level of Negative Price Events, Queensland and SA
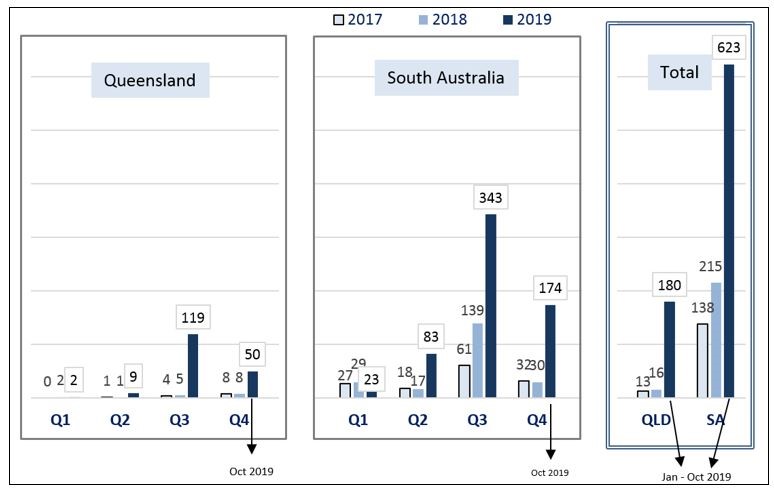 Source: AEC analysis
Figure 2: Negative prices in South Australia 2018-2019[iv] *click on graph to view larger image
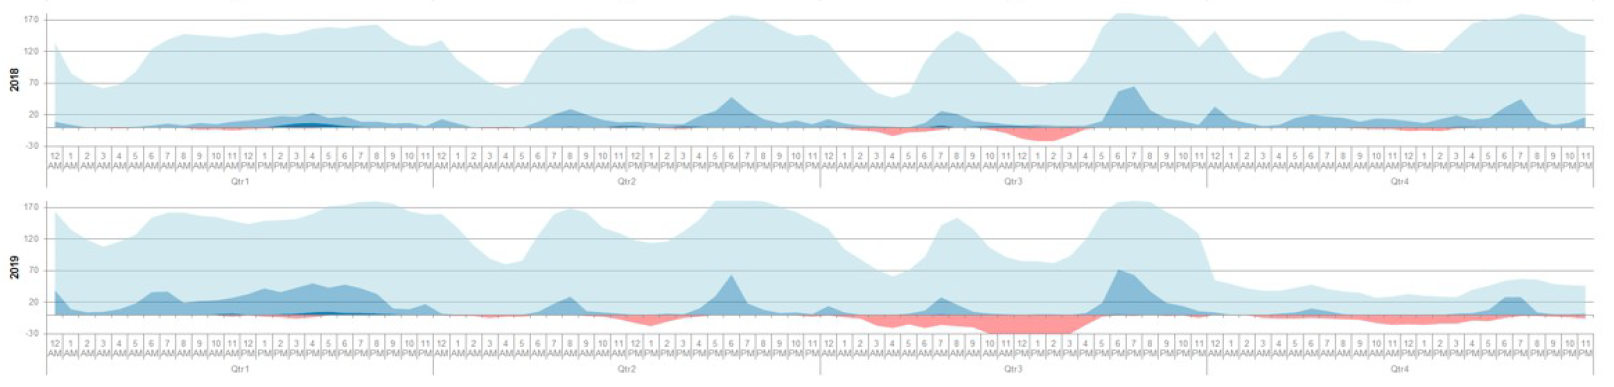 Blue = frequency >A$70/MWh, A$150/MWh, A$1,000/MWh Pink = frequency <a$0 mwh=""></a$0>Source: Morgan Stanley Research, AEMO
Figure 3: Negative prices in Queensland 2018-2019 *click on graph to view larger image
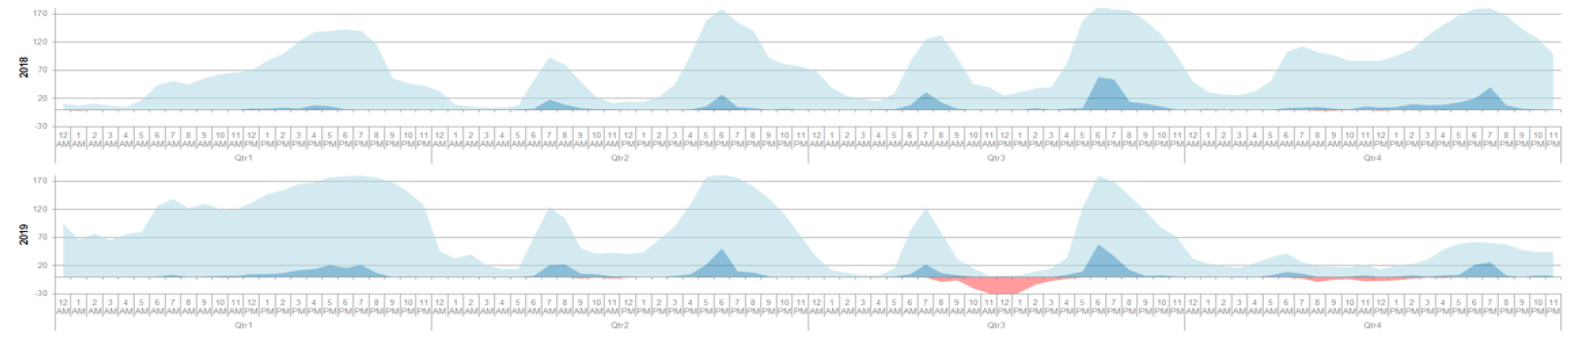 Blue = frequency >A$70/MWh, A$150/MWh, A$1,000/MWh Pink = frequency <a$0 mwh=""></a$0>Source: Morgan Stanley Research, AEMO
The Australian Energy Market Commission’s (AEMC’s) senior economist, Oliver Nunn, pointed to “a new market dynamic” in Queensland earlier this year[v] with prices around the middle of the day falling to negative levels.
Nunn summarised the trend this way: “The negative prices seen in Queensland during the middle of the day have been accompanied by 17-year lows in residual demand. Around 3,500MW seems to be the tipping point where prices become negative in Queensland. We may be seeing the first glimpses of a new market dynamic. More small-scale solar PV and more large-scale renewables can only be expected to fuel this new trend.”
AEMO notes that negative and zero prices led to comparatively high curtailment of renewable generation output due to some wind and solar farms re-bidding to higher prices and not being dispatched during negative intervals. Self-curtailment is undertaken to avoid wind and solar farms paying to generate. Around 27MW of renewable output was self-curtailed compared to 9MW in the corresponding period in 2018.
There was also new constraints on five solar farms in Victoria and NSW which reduced average solar output but only by 14MW.
With the high level of negative and zero spot prices, wholesale prices in Queensland and SA fell in the third quarter compared to the same quarter in 2018. Queensland’s average spot price was $62/MWh – the lowest quarterly average mainland NEM price since the same quarter in 2016. SA’s average spot price was $75/MWh – the lowest for that region since the first quarter of 2016. Reduced prices in these two states was also helped by a large increase in Queensland solar generation while lower wholesale gas prices benefited SA.
Victoria’s average price increased to $98/MWh. The state had record low levels of brown coal-fired generation and reduced availability of lower-priced hydro generation. This was due to a combination of low water conservation measures with continued dry conditions and an outage on the Basslink interconnector. While New South Wales’ average price was consistent with recent quarters.
Electricity futures
While spot prices have fallen AEMO’s latest assessment shows that ASX Electricity futures continued to rise with Calendar 2020 swaps reaching record average highs across all mainland regions.
Figure 4: ASX Futures
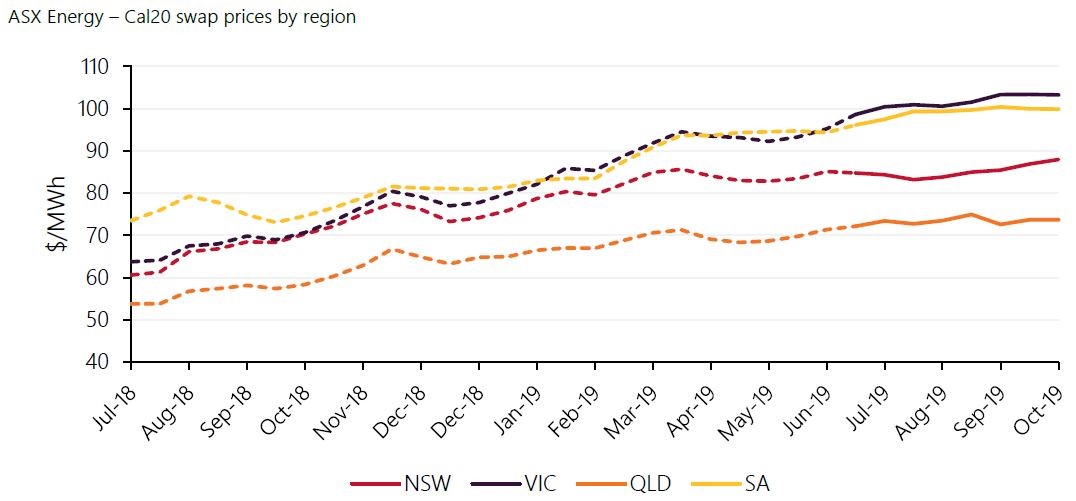 Source: AEMO
Price setting trends
Overall AEMO found that there was increased price setting by gas generation. Gas was the marginal fuel type for generation for nearly a quarter of the time (23 per cent) – the third highest quarterly level since 2010. With lower wholesale gas prices (they fell for the first time in a year and averaged 7.95/GJ in the third quarter, 16 per cent lower than in Q2 2019 and Q3 last year).
Renewable generation also set the price more often during the third quarter. AEMO reported that periods of oversupply in Queensland and SA led to renewable generation establishing a record for the amount of time it set the price.
A further contributing factor was generators set the price in their local region more often than in recent quarters in all NEM regions, except Victoria.
[i] https://www.energycouncil.com.au/analysis/are-renewables-generating-a-new-market-dynamic/; https://www.afr.com/companies/energy/why-electricity-spot-prices-are-hitting-zero-20190723-p52a08
[ii] Quarterly Energy Dynamics Q3 2019
[iii] “These are for use at the discretion of AEMO control room staff to meet any requirement that results in the need to limit power flow on major network components. Discretionary constraints may be used with routine planned network outages where a constant limit on power flow is required. They may also be used as a post-contingent response to reduce or limit network power flow or at any time that a system security issue arises and control of power flow on a single network element is required”. https://www.aemo.com.au/-/media/Files/Electricity/NEM/Security_and_Reliability/Power_System_Ops/Procedures/SO_OP_3705---Dispatch.pdf
[iv] Morgan Stanley’s horizon charts show the frequency distribution of pool prices over time. The x-axis is split into quarters (to show seasonality), and by hours (to show intra-day Duck Curve effects). Each row shows a calendar year, and the y-axis in each row is the number of instances in the relevant time period where prices were within the designated bands, eg, the pink areas show the recent growth in frequency of negative daylight prices, associated with Duck Curves.
[v] https://www.energycouncil.com.au/analysis/are-renewables-generating-a-new-market-dynamic/
Send an email with your question or comment, and include your name and a short message and we'll get back to you shortly.