

by Carl Kitchen
Are renewables generating a “new market dynamic”?
This week the Clean Energy Regulator (CER) announced that it had approved enough generation capacity to meet the 33,000GWh Renewable Energy Target[i].
The CER stated that 6,400 megawatts of large-scale renewable capacity had to be built between 2017 and 2019 to generate sufficient electricity to meet the target and on 30 August, the milestone was met ahead of schedule with the approval of four large wind and solar power stations, with a combined capacity of 406 megawatts.
Last month the CER also released its annual statement on progress to meeting the 2020 target which showed that in 2018 5,000MW of renewable capacity was installed (1,500MW of small scale solar PV and 3,500MW of large-scale capacity was accredited).
Figure 1: Global per capita renewables deployment rate, 2018
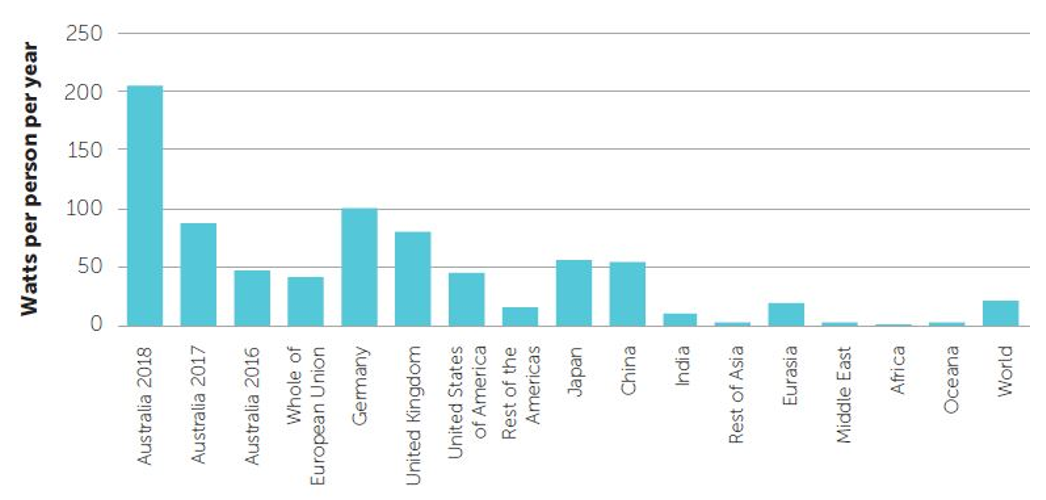
Source: Clean Energy Regulator 2019
It also highlighted that Australia is now leading the world in per capita deployment for renewables (see figure 1)[ii]. This was reinforced in a paper from the Australian National University that estimates that Australia’s per capita installation of renewable generation is on track to reach 250 watts per person in 2019, up from around 200 watts in 2018 (figure 2).
Figure 2: Renewable capacity per capita data, 2018
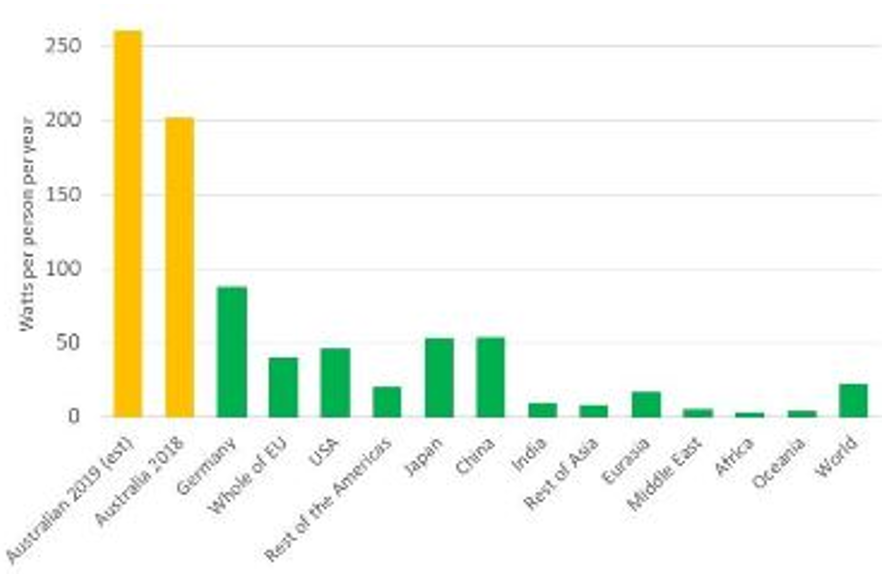
Source: ANU, Powering ahead: Australia leading in renewable energy build rates
According to the Australian National University’s Matthew Stocks, Ken Baldwin and Andrew Blakers, Australia is leading the world in the installation of renewable energy capacity with per capita rates 2.5 times the next best (Germany), 4-5 times faster per capita than the European Union, Japan, the US or China and 10 times the world average[iii].
Reliability and the need to manage the influx of renewable generation will therefore be a focus for the future. It is addressed in the Australian Energy Market Operator’s (AEMO’s) most recent Electricity Statement of Opportunities, and AEMO now has a project to investigate it, the Renewable Integration Study[iv]. But the ongoing growth in renewables is having an impact in other areas in the operation of the National Electricity Market (NEM).
For example, it is becoming more evident in wholesale market prices, most recently in states such as Queensland (due to solar) and South Australia (due to wind). The Australian Energy Market Commission’s (AEMC’s) senior economist, Oliver Nunn, recently pointed to “a new market dynamic” in Queensland with prices around the middle of the day falling to negative levels. He tracked this for five days in August (see figure 3).
Figure 3: Queensland spot price (30-minute basis)
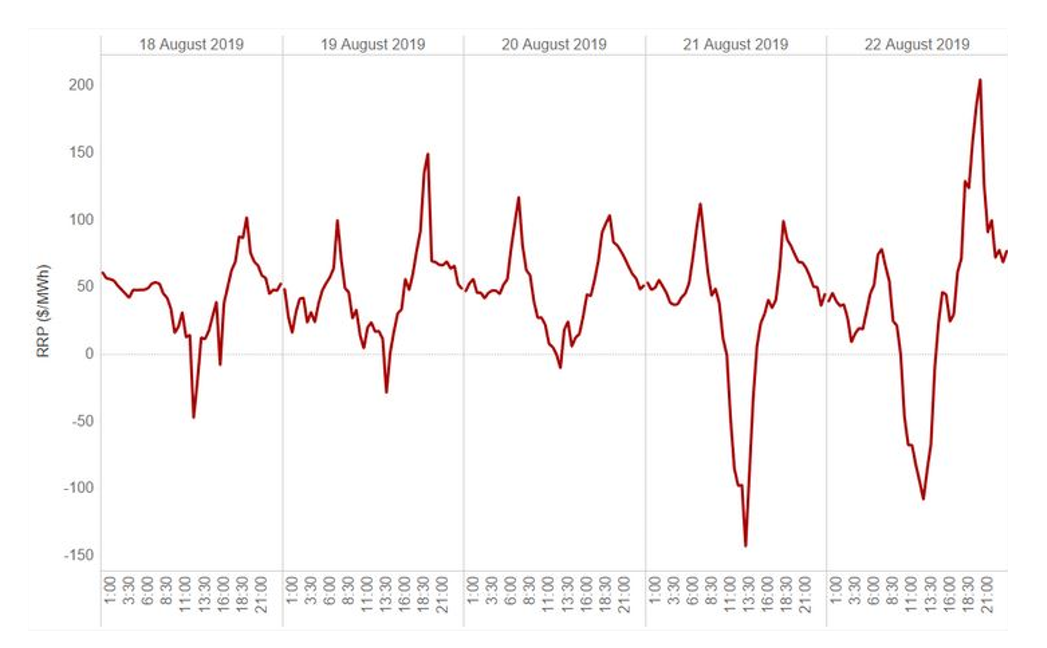
Source: AEMC
The AEMC says the obvious cause is the rise in large-scale solar generation with renewable output reaching record levels as a number of large-scale solar farms have come online, including the Daydream Solar Farm (180MW), Kidston Solar Project (50MW), Sun Metals Solar Farm (125MW), and the Darling Downs Solar Farm (110MW).
AEMO in its most recent quarterly review found that large-scale solar generation increased by 318 MW (+281 per cent) as additional capacity was brought online[v]. Most of the increase in large-scale solar output was in Queensland (195 MW, 61 per cent of the increase). Average Q2 2019 rooftop PV generation increased from 669 MW to 827 MW (+19 per cent) compared to Q2 2018.
What was described as a “collapse” in the spot price in Queensland occurred this week[vi] saw trading prices for the 30 minutes to 10am of -$413.65/MWh followed by -$711.11/MWh, according to Global-ROAM.
In his assessment of the emerging trends, the AEMC’s senior economist also considered the impact of the increased renewables on residual demand for energy in Queensland – demand less the output of all semi-scheduled generation. “The values for residual demand seen in August last week are the lowest levels since September 2002, bearing in mind that in 2002 there was no semi-scheduled generation in Queensland”. Figure 4 shows the average, maximum and minimum residual demand for Queensland on a monthly basis going back to 2000.
Figure 4: Residual Demand Queensland 2000-2019
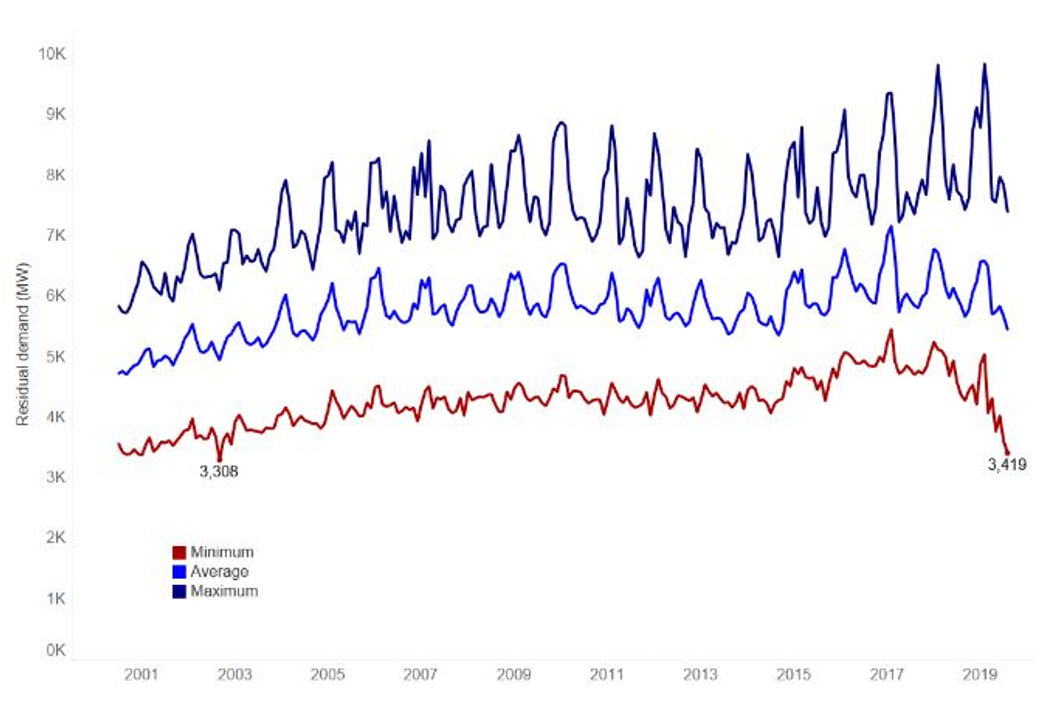
Source: AEMC Economists Corner
Nunn summarised the trend this way: “the negative prices seen in Queensland during the middle of the day have been accompanied by 17-year lows in residual demand. Around 3,500MW seems to be the tipping point where prices become negative in Queensland. We may be seeing the first glimpses of a new market dynamic. More small-scale solar PV and more large-scale renewables can only be expected to fuel this new trend.”
South Australia has seen a similar impact on prices but largely driven by its wind generation. The state has more than 1,800MW of wind installed. Figure 5 shows prices in SA during the same five-day period in August.
Figure 5: SA Spot Prices 18-24 August 2019
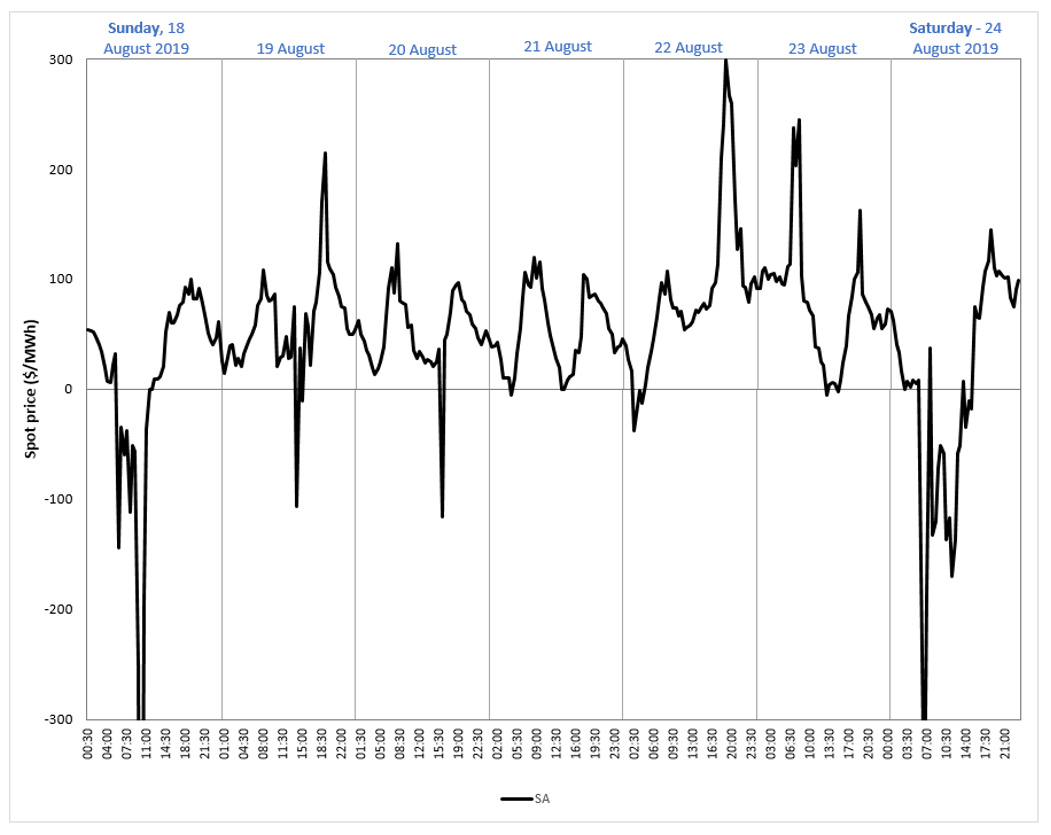
According to EnergyEdge, South Australia saw negative spot electricity prices for 9.9 per cent of the month of August[vii].
AEMO’s Q2 report noted that “in South Australia, negative prices were at comparatively high levels for the first half of 2019, with almost 53 negatively-priced hours (although still only 1.2 per cent of the time), the second highest year-to-date level on record (Figure 24). Negative prices over Q2 2019 contributed to South Australia’s average spot price being $6/MWh lower than Victoria’s.”
Typical drivers of the negative prices included:
- Increased renewable capacity and output. Since the start of 2018, 709 MW of new renewable capacity has been commissioned in SA, which has led to increased output, such as at times of high winds.
- Comparatively low operational demand (<1,200 MW). AEMO notes that minimum operational demands in the state continue to decline, driven by uptake of rooftop PV.
- Constraints on the VIC-SA interconnectors.
Figure 6 shows the incidence of negative pricing in SA.
Figure 6: Comparatively high prevalence of negative pricing this year. Cumulative negative prices in South Australia – YTD15
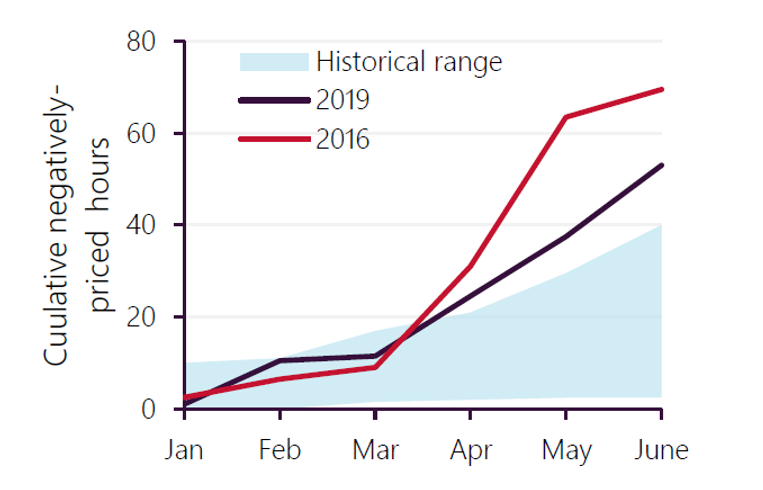
Source: AEMO Q2 Report
Last year wind provided 44 per cent of the state’s electricity (with gas providing 53.2 per cent, solar 2.3 per cent and the “big battery” 0.3 per cent), which is shown below.
Figure 7: SA Generation by type
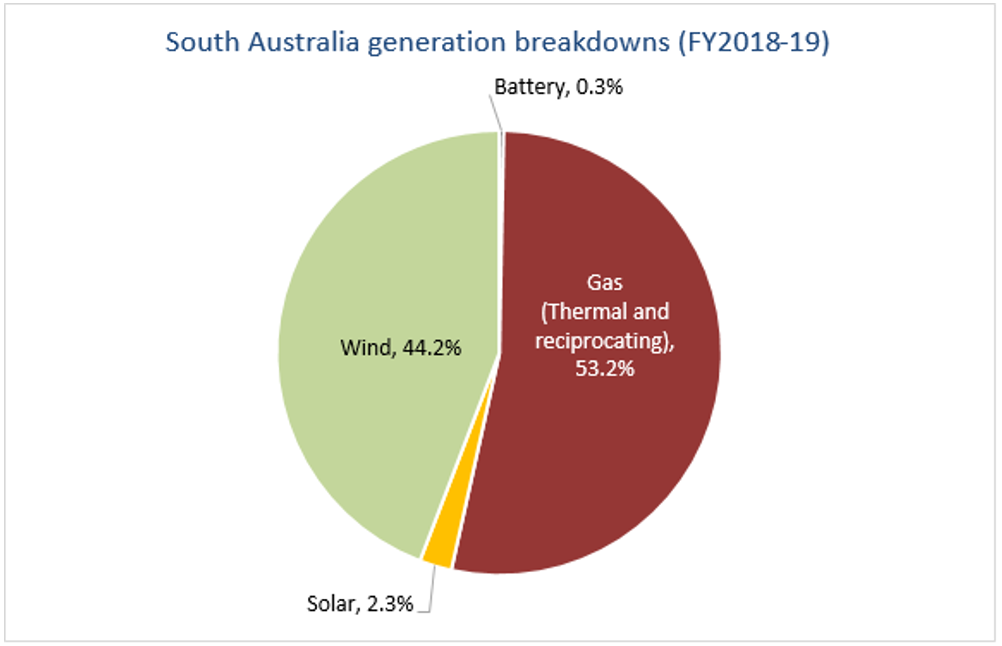
Source: NEO – IESYS for the pie chart
Wind farms are receiving an increasingly discounted price as can be seen in Figure 8 below, which shows that as the capacity of wind in the state has grown, so too has the discounted price it receives.
Figure 8: Wind discount price, South Australia
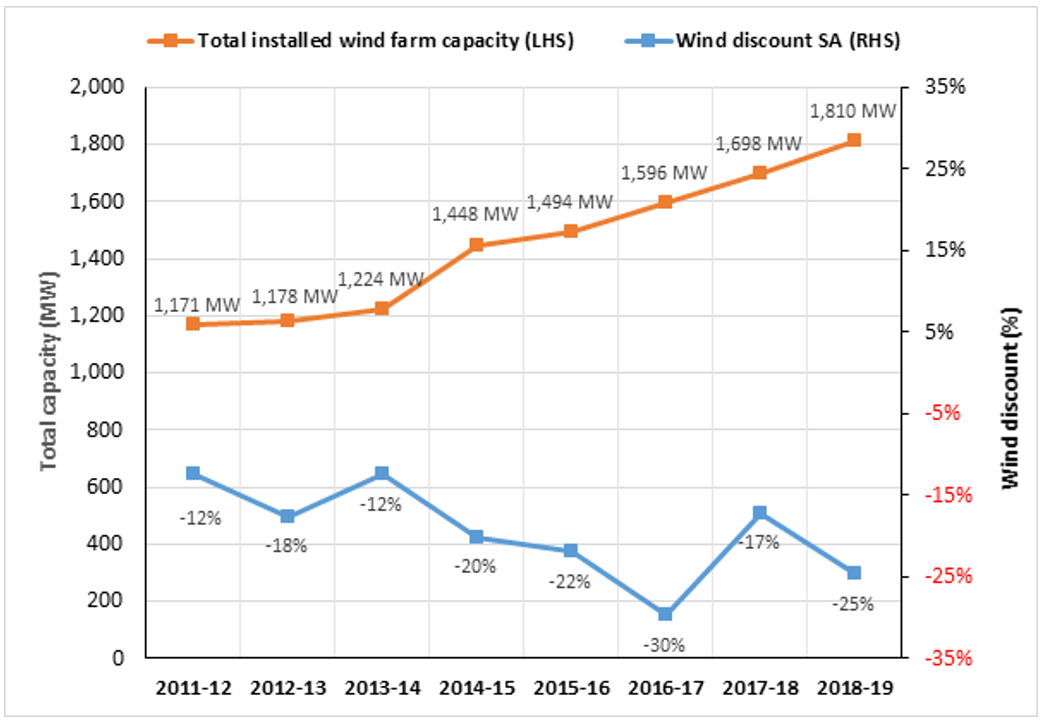
Source: AEC analysis
AEMO in its Q2 report also noted that South Australia set a new Q2 minimum demand record at 1330 hrs on 27 April 2019, when operational demand dropped to 749 MW (44 MW lower than the previous Q2 record last year) with rooftop solar output a factor, providing about 600MW at that time.
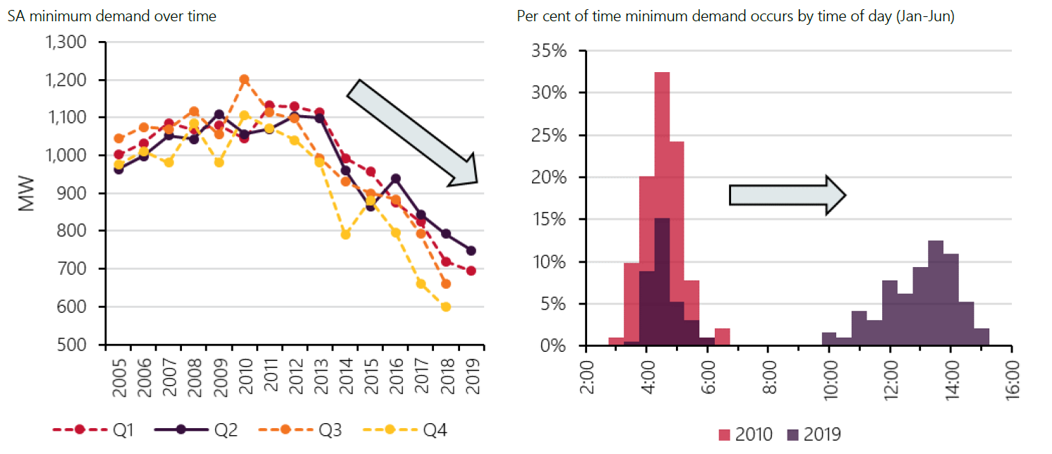
AEMO reported that: “the minimum demand levels in the state have been falling for almost a decade, largely driven by increasing uptake of rooftop PV in the region. According to the CER, as at the end of June 2019, South Australia had approximately 1 gigawatt (GW) of small-scale solar capacity installed. This has driven a considerable reduction in operational demand over the middle of the day, shifting the time of minimum demand from the early morning to the middle of the day. Reduced commercial and industrial load in the region has also contributed to this trend. This shift in the time of demand is limited to South Australia at present. For other NEM regions, the overnight period remains the lowest demand part of the day” (see figure 9).
Figure 9: SA minimum demands are declining and the time of minimum demand has shifted
Source: AEMO Q2 Report
Despite the increasing number of low priced events, the average price remains high by historic levels, due to the uncertainty of variable renewable energy supply and the reliance on peaking generation to fill any shortfalls.
Average daily prices in the NEM ranged from $80.29 (in Queensland) to $109.81 (in Victoria) in 2018-2019[viii]. So far this year, AEMO reports average daily prices of between $61.31 and $95.84.
[i]http://www.cleanenergyregulator.gov.au/About/Pages/News%20and%20updates/NewsItem.aspx?ListId=19b4efbb-6f5d-4637-94c4-121c1f96fcfe&ItemId=683
[ii] The acceleration in renewables investment 2018, Clean Energy Regulator
[iii] Powering ahead: Australia leading the world in renewable energy build rates, ANU, September 2019
[iv] https://www.aemo.com.au/Electricity/National-Electricity-Market-NEM/Security-and-reliability/Future-Energy-Systems/Renewable-Integration-Study
[v] AEMO, Quarterly Energy Dynamics Q2 2019, 9 August 2019
[vi] “Qld generators hit by negative prices”, Australian Financial Review, 5 September 2019
[vii] “Bigger price spikes cancel out $0 power”, Australian Financial Review, 3 September 2019
[viii] AEMO Date Dashboard
Related Analysis
Wild Cards: Could these technologies advance the energy transition?
In December 2022, scientists at the National Ignition Facility achieved a landmark nuclear fusion result: a reaction that produced more energy than the laser pulse used to start it. It made headlines globally, but the caveats came quickly. Overall system energy use was still far higher, and commercial viability remains decades away. It was a real breakthrough, but also a reminder of how far the engineering still has to go. That gap between scientific progress and commercial reality is a defining feature of the energy transition today. While solar, wind, and batteries are scaling rapidly and doing most of the heavy lifting, the International Energy Agency estimates that nearly half of the emissions reductions needed for net zero will depend on technologies still at demonstration stage or earlier. This raises the key question: which “wild card” technologies could help close that gap?We take a look.
Nuclear Fusion Deals – Based on reality or a dream?
Last week, Italian energy company ENI announced a $1 billion (USD) purchase of electricity from U.S.-based Commonwealth Fusion Systems (CFS), described as the world’s leading commercial fusion energy company and backed by Bill Gates’ Breakthrough Energy Ventures. CFS plans to start building its Arc facility in 2027–28, targeting electricity supply to the grid in the early 2030s. Earlier this year, Google also signed a commercial agreement with CFS. These are considered the world’s first commercial fusion-power deals. While they offer optimism for fusion as a clean, abundant energy source, they also recall decades of “breakthrough” announcements that have yet to deliver practical, grid-ready power. The key question remains: how close is fusion to being not only proven, but scalable and commercially viable, and which projects worldwide are shaping its future?
Community Power Network Trial: Potential risks and market impact
Australia leads the world in rooftop solar, yet renters, apartment dwellers and low-income households remain excluded from many of the benefits. Ausgrid’s proposed Community Power Network trial seeks to address this gap by installing and operating shared solar and batteries, with returns redistributed to local customers. While the model could broaden access, it also challenges the long-standing separation between monopoly networks and contestable markets, raising questions about precedent, competitive neutrality, cross-subsidies, and the potential for market distortion. We take a look at the trial’s design, its domestic and international precedents, associated risks and considerations, and the broader implications for the energy market.
Send an email with your question or comment, and include your name and a short message and we'll get back to you shortly.