
by KPMG for the AEC
Marginal Loss Factors: The state of play in Australia
Intra-regional loss factors, also known as Marginal Loss Factors (MLF), represent the transmission losses within each of the five regions of the National Electricity Market (NEM). MLFs depend on factors such as the amount of existing and new generation, electricity flows, and supply and demand. In recent years, supply and demand patterns in the NEM have been changing at an increasing rate, which has increased the volatility of MLFs on a year-to-year basis.
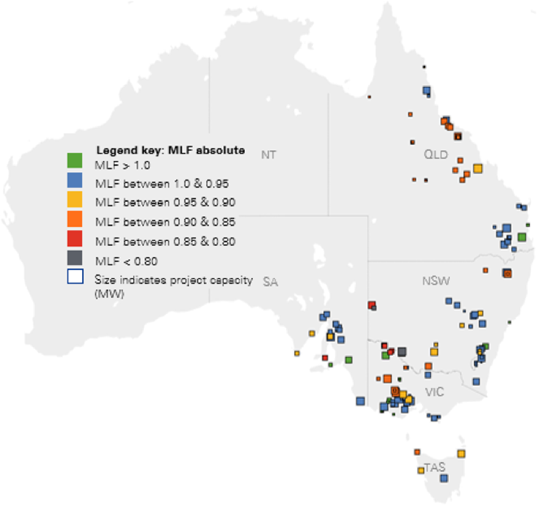
The Australian Energy Market Operator (AEMO) publishes forward-looking MLFs for each generation and load connection point annually, with their latest publication outlining results for the FY2020-21. From this report, the heat map below was created to show the MLF values of a number of renewable energy generators across the NEM.
The MLF for each generation connection point represents the marginal losses in electrical power flow between that connection point and the regional reference node (RRN) for that region. An MLF less than 1.0 indicates that an incremental increase in power flow from the connection point to the RRN would increase total losses in the network, whereas an MLF greater than 1.0 indicates the opposite. As can be seen below, most renewable energy generators have an MLF less than 1.0.
Figure 1: 2020-21 MLFs for a range of renewable generators
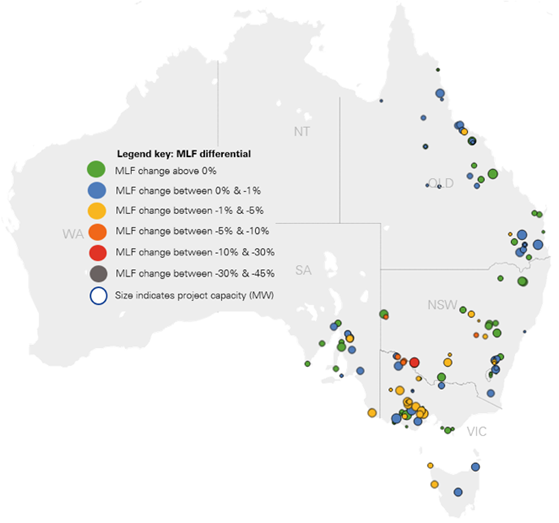
While looking at absolute values gives a good indication of the loss factors in the NEM, the data can also be used to show how MLFs have changed in recent times. The heat map below illustrates the percentage change between 2020-21 and 2019-20 MLFs. Of the 136 renewable generation projects mapped, around 17 per cent of projects experienced a change in MLFs between -1 per cent to -5 per cent over the past 12 months. A longer-term 24-month analysis (comparing FY21 to FY19) period shows approximately 26 per cent of projects experiencing a -1 per cent to -5 per cent change in MLFs.
Figure 2: One year percentage change in MLFs (2020-21 compared to 2019-20)
There are two main reasons why the MLF for a connection point changes from year to year:
- Change to the impedance of the transmission network due to augmentation: If new network is built this will decrease the impedance between a connection point and its RRN, which would be expected to move its MLF closer to 1.0, and vice versa.
- Change to power flows from changes to power system generation and demand. If, for example, the projected power flow from a connection point increased (and everything else was held constant), then the MLF for that connection point may decrease, and vice versa.
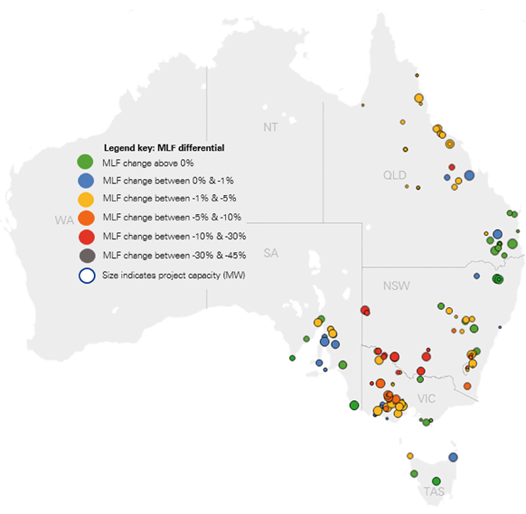
MLF changes between the 2019/20 and 2020/21 financial years are small when compared to the preceding years. Generally, this is driven by the smaller changes in generation mix and the emergence of new generation limits. When 2020-21 MLFs are compared against those forecasted in 2018-19, significantly larger reductions in MLFs (up to 30 per cent) can be seen, as illustrated by the heat map below.
Figure 3: Two year percentage change in MLFs (2020-21 compared to 2018-19)
New renewable energy capacity is increasingly connecting at the periphery of the transmission network, including north-west Victoria, south-west New South Wales and north and central Queensland. In these areas, access to renewable resources is good, however, the network is electrically weak and remote from the major demand centres.
MLFs are calculated by forecasting generation and load profile forecasts for the year the MLFs will be applied. AEMO obtains historical MW data for each half-hour trading interval. The annual MLFs are calculated by averaging the loss factors for each trading interval and for each connection point. Typically AEMO’s MLF calculation weights half-hourly generation loss factors against generation output. For instance, a typical solar farm’s annual MLF will be close to its midday MLF.
MLF reductions are exacerbated by highly correlated generation profiles in a particular area. This can be illustrated by looking at the time-of-day average MLF and percentage generation for a particular solar farm, located in an area with a high solar penetration, as shown below.
Figure 4: Impact of highly correlated generation profiles on MLFi
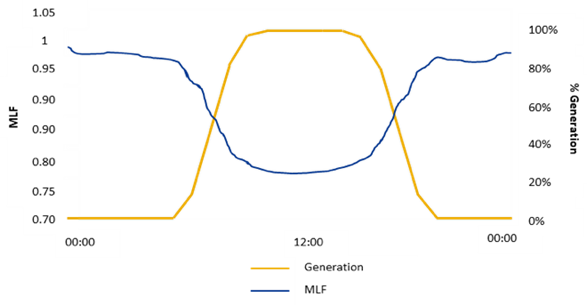
When the generation during the day is nearly 100 per cent, the MLF is below 0.8, resulting in a volume weighted average MLF of around 0.80 for this particular generator. However, if a generator with a completely independent generation pattern connects in this area, it would be expected to have a higher MLF than the solar farm.ii As an example, the FY21 MLF for Queensland’s Barron Gorge hydro-electric power station is 0.9356, which is higher than the Kidston Solar Farm with an MLF of 0.8907.
Wrapping up
So what do these loss factors ultimately mean for participants in the NEM?
MLFs are one of the key locational signals for investment decision making in the NEM, as an area with higher MLFs will result in higher project revenues and vice versa. Due to the financial implications of MLFs, investors need to carefully consider the characteristics of the local grid when determining the location of their project, including the likely impact on their future MLF from subsequent new connections and/or closures of plant.
Written by Sabine Schleicher, Partner KPMG and Daniel Hamel, Director KPMG.
[i] Time-of-day MLFs for each generator in the NEM is generally not published. Graph shown is an excerpt from AEMO’s Marginal Loss Factor for the 2020-21 financial year report demonstrating the impact of highly correlated generation profiles on MLF.
[ii] Marginal Loss Factors for the 2020-21 financial year. AEMO (2020).
Related Analysis
Certificate schemes – good for governments, but what about customers?
Retailer certificate schemes have been growing in popularity in recent years as a policy mechanism to help deliver the energy transition. The report puts forward some recommendations on how to improve the efficiency of these schemes. It also includes a deeper dive into the Victorian Energy Upgrades program and South Australian Retailer Energy Productivity Scheme.
The return of Trump: What does it mean for Australia’s 2035 target?
Donald Trump’s decisive election win has given him a mandate to enact sweeping policy changes, including in the energy sector, potentially altering the US’s energy landscape. His proposals, which include halting offshore wind projects, withdrawing the US from the Paris Climate Agreement and dismantling the Inflation Reduction Act (IRA), could have a knock-on effect across the globe, as countries try to navigate a path towards net zero. So, what are his policies, and what do they mean for Australia’s own emission reduction targets? We take a look.
UK looks to revitalise its offshore wind sector
Last year, the UK’s offshore wind ambitions were setback when its renewable auction – Allocation Round 5 or AR5 – failed to attract any new offshore projects, a first for what had been a successful Contracts for Difference scheme. Now the UK Government has boosted the strike price for its current auction and boosted the overall budget for offshore projects. Will it succeed? We take a look.
Send an email with your question or comment, and include your name and a short message and we'll get back to you shortly.