

by Carl Kitchen
Increases in negative prices: Is it a positive?
If there is one thing the Australian Energy Regulator’s (AER) State of the Energy Market report has reminded us, it’s that the National Electricity Market (NEM) can be a wild ride at times.
After a mild summer and low demand helped the NEM achieve the lowest first quarter wholesale prices since 2012, tight supply - due to plant outages, reduced operations, increased fuel costs and higher demand - led to increased price volatility over the past couple of months.
Despite these recent price spikes, the number of negative price events is a trend that has become increasingly noticeable in the NEM in the past couple of years.
There were 3662 instances in 2020 of negative prices – a record – and triple the number seen in 2016. And the high level of negative prices was also noticeable in the first quarter of this year. The trend since 2016 is highlighted in figure 1 below:
Figure 1: Negative price intervals
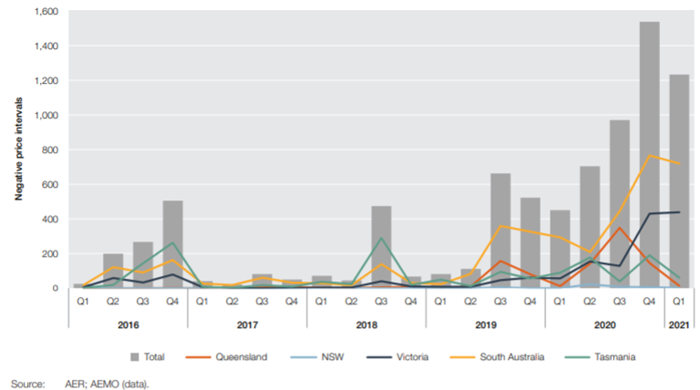
Source: AER, State of the Energy Market 2021
A key factor behind this trend is the increased capacity of renewable generation entering the grid. Typically, they will be competing with each other at the same time which helps drive down prices significantly when the sun is shining or the wind is blowing and demand is low. This is noted by the AER:
“With multiple generators of similar technology competing for dispatch, the likelihood of negative prices increases. Negative prices tended to occur when electricity demand is low and weather conditions are optimal for renewable generation”.
While this was more noticeable overnight historically, another development is that it is becoming more common during the day. In South Australia, for example, which reported negative spot prices 16.8 per cent of the time in the first quarter this year, the average spot price during peak solar production times (between 10am and 3:30pm) was negative $12/MWh.
Figure 2: Average underlying electricity price by time of day, SA – Q1 2021 and Q1 2020

Source: AEMO
Overall, in 2020 nearly half of all negative prices occurred in South Australia which reflects its high levels of wind and solar generation. More than 40 per cent of the negative prices last year were in the fourth quarter, exceeding the preceding quarterly record that was set in the third quarter.
There were negative and zero spot prices in 7 per cent of all trading intervals across the NEM in the fourth quarter compared to 4.6 per cent of the trading intervals in the previous quarter. South Australia dropped to negative prices 17 per cent of the time in the fourth quarter, while Victoria recorded these 10 per cent of the time. Queensland also saw a high level of negative and zero prices mainly between mid-morning and mid-afternoon because of its solar capacity.
During the first quarter this year negative and zero spot prices were seen 5.8 per cent of the time of all trading periods (up from 2.3 per cent in the corresponding period last year). Negative spot prices occurred in the NEM’s southern states and at very high levels in South Australia (16.8 per cent) and Victoria (10.3 per cent). The Australian Energy Market Operator (AEMO) reports that while the negative prices led to a $10/MWh drop in South Australia’s average quarterly price, they had minimal influence on Victoria’s wholesale prices which were just $1.9/MWh lower, which is attributed to the lack of any trading interval when the state’s spot prices were under -$100/MWh.
Key drivers of increased negative prices in SA and Victoria in the first quarter, according to AEMO, were:
- Increased periods of very high Victorian and South Australia renewable generation, mainly due to new capacity installed in Victoria and reduced curtailment of existing capacity. The combined Victorian and South Australian output was above 2500MW 11 per cent of the time, compared to 4 per cent a year earlier.
- Low daytime operational demand: Combined demand in the two states dropped below 4500MW 8.3 per cent of the time, compared to 3.8 per cent in Q1 2020 with high negative spot prices during the middle of the day as shown below.
Figure 3: Percentage of negative spot prices by time of day – SA and Vic, Q1 2021 vs Q1 2020
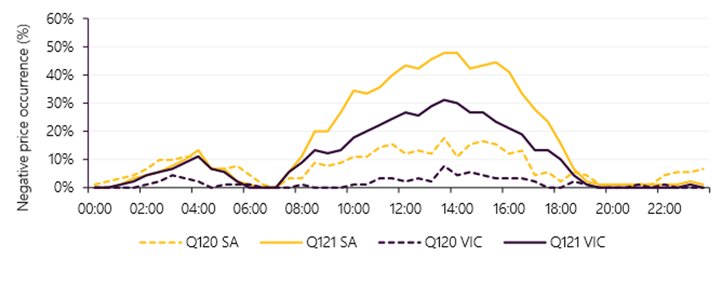
Source: AEMO
Why so negative?
The NEM has a market floor price of -$1000/MWh and allowing generators to offer capacity at negative prices increases their chances of being dispatched. Generators will offer this capacity because it may be more cost-effective to offer capacity to ensure continuous operation. In the case of a baseload generator, for example, they will have a minimum on-line loading level so may stay on to avoid the costs of having to shut down and restart. A generator’s hedge contract position may also determine how it bids. If a generator has a contract ahead of time that ensures a fixed price for its output, it may only be minimally exposed to negative prices[i].
Renewable generators who are accredited for every MWh they produce via Large Generation Certificates (LGCs) under the Renewable Energy Target, may also be able to operate profitably even with negative prices.
Commercial PPAs with renewable generators may have a clause that they don’t pay out when the wholesale price is less than zero, which protects the buyer against these outcomes.
The market operator has reported that high levels of negative prices in the past two quarters has led to an increased response from wind and solar farms in the form of re-bids of their capacity to higher price bands.
The increase in re-bidding has also been driven by the introduction of rebidding software with AEMO estimating around a third of South Australia and Queensland renewable generating capacity now has the software, while around a fifth of the capacity in Victoria use this software.
In the first quarter 2019 South Australia and Victorian wind and solar farms re-bid 4258 times and by the comparable quarter this year there were 34,659 re-bids, a 713 per cent increase.
Figure 4: Re-bidding frequency wind and solar Farms
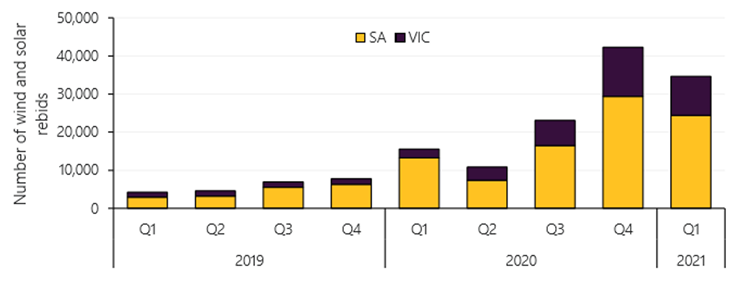
Source: AEMO
In its fourth quarter 2020 report, AEMO noted re-bids was higher among newly commissioned projects.
Negative spot prices also contributed to increased self-curtailment of output in the quarter (averaging 61MW, up from 42MW in the same quarter in 2019) with the largest regional increases in economic curtailment seen in Victoria and South Australia. In the first quarter this year economic curtailment accounted for 58 per cent of total curtailment. Economic curtailment is where a wind or solar farm’s output is reduced from what it could produce based on the weather conditions.
In March this year the Australian Energy Market Commission introduced a rule change requiring semi-scheduled generators to generate based on the available resource and their offers and not turn off without instructions from the market operator.
[i] AER, State of the Energy Market 2021
Related Analysis
Australia’s Home Battery Surge: A Question of Equity
Australia is a global leader in rooftop solar, with more than 4.3 million households and small businesses installing photovoltaic (PV) systems as of February 2026. Battery uptake has also accelerated, particularly since the introduction of the Cheaper Home Batteries Program in July 2025, which offers around a 30 per cent upfront discount for systems between 5 kWh and 100 kWh. More than 236,000 batteries had been installed by February 2026, although this likely understates the true figure due to reporting lags; the Federal Government has since indicated installations have surpassed 250,000 as of March 2026. Despite this rapid growth, an important question remains: who is actually benefiting from these subsidies?
Integrated System Plan – What Should We Expect?
The release of an expert study of last year’s autumn wind drought in Australia by consultancy Global Power Energy[i] this week raised some questions about the approach used by the Australian Energy Market Operator’s in its 2024 Integrated System Plan (ISP). The ISP has been subject to debate before. For example, there has previously been criticism that some of the ISP’s modelling assumes what amounts to “perfect foresight” of wind and solar output and demand[ii], rather than a series of inputs and assumptions. The ISP is produced every two years and with the draft of the next ISP (2026) due for release soon, it is useful to consider what it is and what it is not, along with what the ISP seeks to do.
Getting it right: How to make the “Solar Sharer” work for everyone
On paper, the government’s proposed "Solar Sharer Offer" (SSO) sounds like the kind of policy win that everyone should cheer for. The pitch is delightful: Australia has too much solar power in the middle of the day; the grid is literally overflowing with sunshine: let’s give households free energy during 11am and 2pm. But as the economist Milton Friedman famously warned, "There is no such thing as a free lunch." Here is a no-nonsense guide to making the SSO work.
Send an email with your question or comment, and include your name and a short message and we'll get back to you shortly.