

by Carol Tran
Electricity exports: What did the NEM do last summer?
With the close of summer, a media report was quick to highlight that New South Wales power stations had “kept the lights on in Victoria” [i]. This was the first summer in which Victoria did not have access to the 1600MW of baseload generation provided by the Hazelwood brown-coal fired power station, which closed in March 2017.
So what did happen with interconnector flows during the most recent summer and how does it compare to previous summers? Below we take a closer look at the changing shape of electricity flows between regions in the National Electricity Market (NEM) and some of the impacts this changing generation mix is having on wholesale power prices.
There is no doubt that Victoria has imported more electricity from all the states with which it has interconnectors (see figure 1). At the same time Victorian supplies going into South Australia fell 70 per cent, and its exports to Tasmania were 28.5 per cent lower. Imports from those states were also higher.
Exports from Victoria into New South Wales fell 79 per cent, while exports from NSW to Victoria increased substantially (2,199 per cent), although from a relatively small export amount of 452 GWh in the previous summer. Exports from Queensland into NSW also jumped by 89.7 per cent to help meet tighter supply-demand in the southern states.
Figure 1: Interconnector flows in NEM
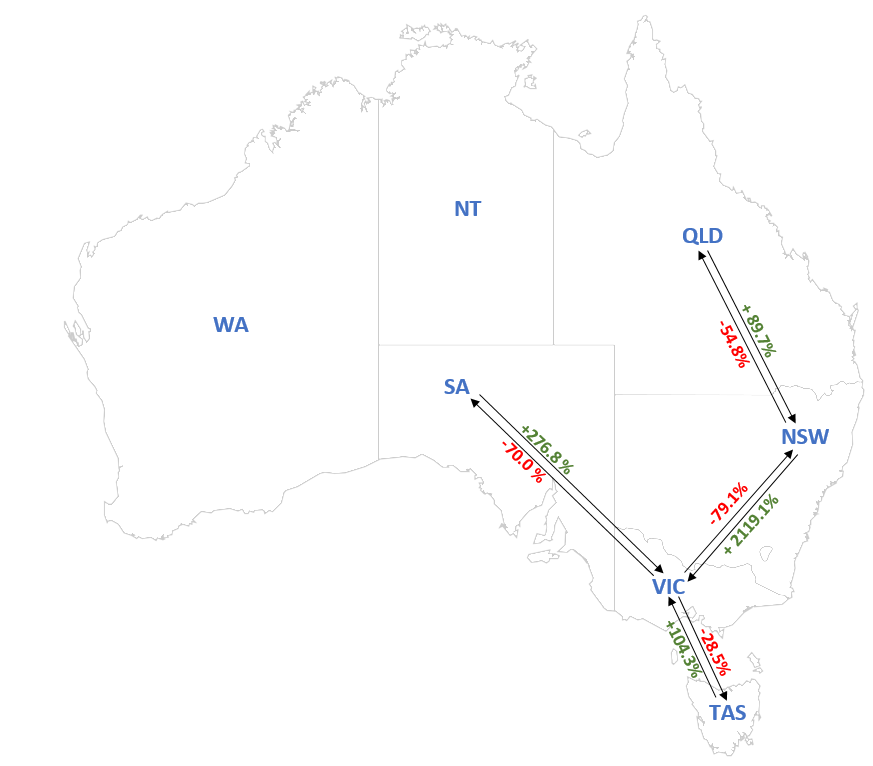
Source: Australian Energy Council
Figure 2 shows the import and export levels between NEM regions over the past three summers. During the most recent summer, import levels decreased across all states, except Victoria. Victoria is the most interconnected region in the NEM, with high voltage connections to Tasmania, New South Wales and South Australia.
In 2017-18 Victoria imported 915 GWh, a jump from 181GWh and 235GWh in the previous two summer periods. Interestingly, all other NEM regions increased their energy exports in 2017-18, while Victoria was the only state where exports dropped in comparison to the previous two summers. Its exports this summer were 66 per cent lower than the previous summer of 2016-17.
Despite this, the state remained the second largest exporter of electricity, slightly behind the electricity exports from Queensland generators as shown below.
Figure 2: Import and Export across interconnectors in NEM regions during summer
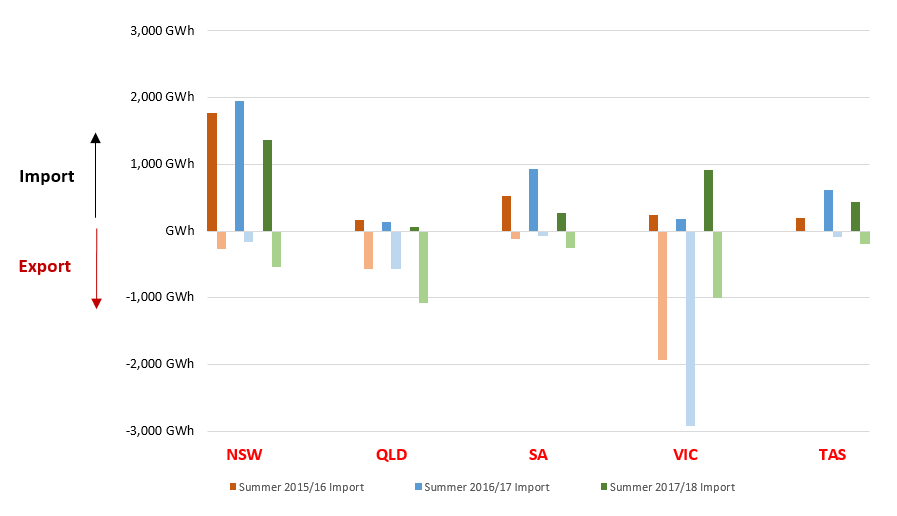
Source: Source: Australian Energy Council’s analysis of NEM-Review data
Figure 3 shows the percentage of each NEM state’s generation which is exported. Victoria has always been the highest exporter with at least 5 per cent of its total generation sent interstate in the past three summers. The state shows a clear drop in summer 2017-18, down from 14.1 per cent to a low of 5.5 per cent, while other NEM regions increased to around double the previous 2016-17 summer’s export levels.
Figure 3: The percentage of export over the state generation
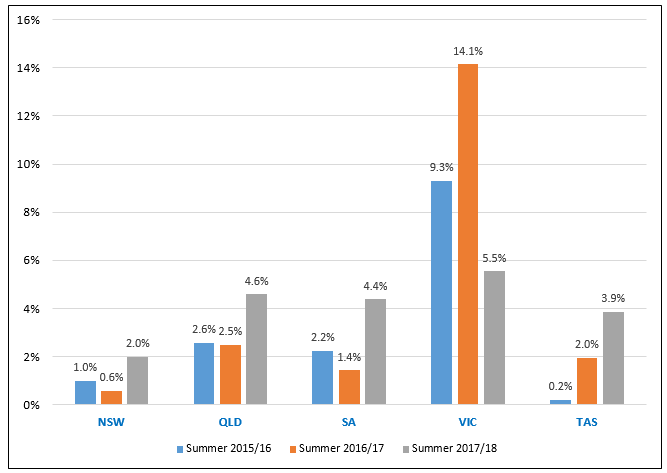
Source: Source: Australian Energy Council’s analysis of NEM-Review data
Impact on Prices: The ups and downs
Higher temperatures are also generally associated with higher spot prices as demand increases particularly as consumers increase their use of air conditioners. The volume-weighted average price (VWA) in Victoria rose in summer 2017-18 to $124.22/MWh, which is nearly double the price compared to the previous summer ($64.20/MWh). In South Australia, extremely high demand during the December – February 2017-18 period resulted in a VWA price of $148.57/MWh, the highest in the NEM. The other notable change in VWA was in Queensland, which saw prices over summer 2017-18 reach $75.36/MWh compared to $188.46/MWh in the previous corresponding period. The return to full capacity of the 385MW Swanbank E gas-fired power station in January 2018 helped reduce the stress on electricity prices.
In 2017, there has been significant tightening in the balance between supply and demand in the NEM largely as a result of increasing demand in Queensland and the retirement of the baseload power stations in Victoria and South Australia (Northern)[ii]. Table 1 shows the change in VWA prices over the past four summers.
Table 1: Volume-weighted average of NEM prices December – February 2014 to present
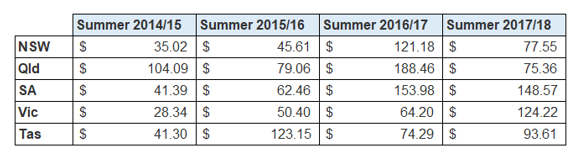
Source: Australian Energy Council’s analysis of NEM-Review data
Summer also resulted in an increase in the amount of time that electricity spot prices were negative, particularly in Tasmania and South Australia. As the penetration of renewables in the electricity mix increases, it is anticipated that both the frequency and duration of times when unscheduled renewable generation displaces scheduled generation will increase and become more the norm – that is also expected to lead to more frequent and rising negative prices in wholesale electricity markets, according to EEnergy Informer[iii].
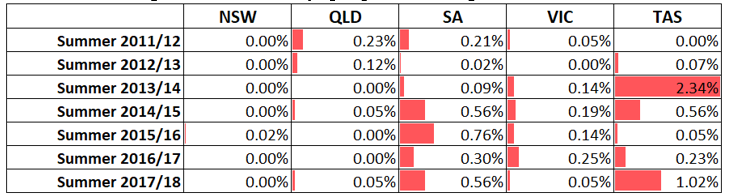
This summer Tasmania surpassed South Australia as the state with the highest occurrence of negative spot prices (1.02 per cent of the time). Table 2 shows the percentage of time in which electricity spot prices drop below $0 across the five NEM regions during the past seven summer periods.
Table 2: Percentage of time electricity spot prices are negative
Source: Australian Energy Council’s analysis of NEM-Review data
Tasmania’s 1.02 per cent this year is still lower than the summer of 2013-14 when the state reported that for 2.34 per cent of the time power spot prices were negative. During 2013-14, water storage levels in Tasmania decreased to around 28.1 per cent of capacity as at 30 June 2014 compared to 33.6 per cent a year earlier as the state increased its hydro generation, which was encouraged by the previous carbon pricing mechanism and demand for lower carbon emitting generation[iv]. Additionally, the commissioning of the Musselroe Wind farm in October 2013 increased the contribution of wind generation from 3.6 per cent in 2012-13 to 7.2 per cent of electricity generated in Tasmania[v].
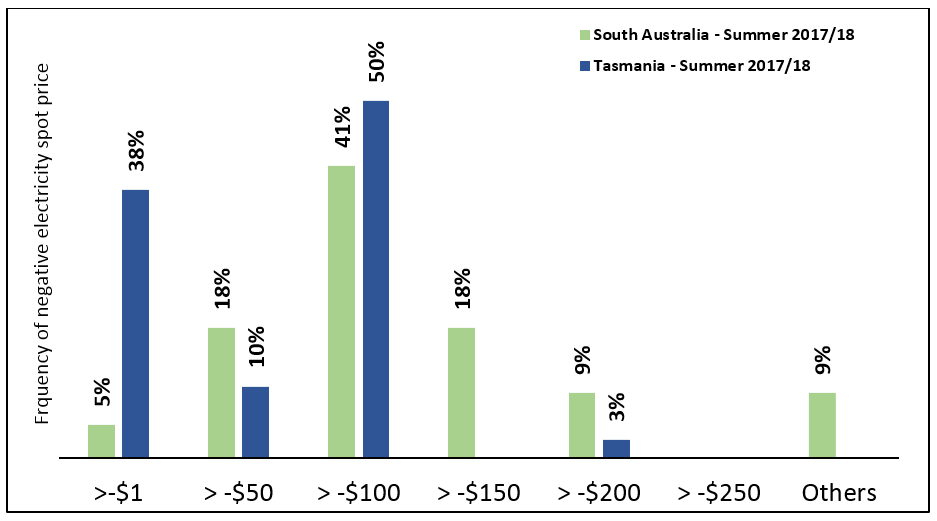
It is worth taking a look at the degree of negative prices in both Tasmania and South Australia. South Australia experienced the highest volatility of electricity prices in summer. For instance, the spot price approached the market price cap when it reached $14,166.50/MWh on 18 January 2018, while less than two weeks later (30 January 2018) the price went down to -$291.71/MWh. That volatility is a reflection of the supply-demand balance in South Australia’s electricity system.
Despite Tasmania having the highest percentage of time of negative electricity prices (accounting for 38 per cent of the total occurrence of negative prices when prices were in the range of $0 to-$1/MWh, compared to 5 per cent of the time in South Australia). South Australia had negative prices lower than -$150/MWh for 36 per cent of the time, compared to only 3 per cent of the time in Tasmania.
Figure 4: The frequency of negative electricity prices in South Australia and Tasmania during summer 2017/18
Source: Australian Energy Council’s analysis of NEM-Review data
As the NEM continues to transform with the introduction of more renewables, potentially more hydro pumped storage, as well as the emergence of new technologies such as large-scale batteries, we can expect to continue to see shifts in the supply-demand balances within regions, and the consequential effect of changing export profiles.
[i] “Proof we’ve got the power over Victoria”, Daily Telegraph, 1 March 2018
[ii] Swanbank E Power Station to return to service, STANWELL, 7 June 2017
[iii] New Normal: Negative Electricity Prices, EEnergy Informer The International Energy Newsletter, February 2018
[iv] Energy in Tasmania Performance Report 2013-14, Office of the Tasmanian Economic Regulator
[v] ibid
Related Analysis
Is increased volatility the new norm?
This year has showcased an increased level of volatility in the National Electricity Market (NEM). To date we have seen significant fluctuations in spot prices with prices hitting both maximum price caps on several occasions and ongoing growth in periods of negative prices with generation being curtailed at times. We took a closer look at why this is happening and the impact this could have on the grid in the future.
Is there a better way to manage AEMO’s costs?
The market operator performs a vital role in managing the electricity and gas systems and markets across Australia. In WA, AEMO recovers the costs of performing its functions via fees paid by market participants, based on expenditure approved by the State’s Economic Regulation Authority. In the last few years, AEMO’s costs have sky-rocketed in WA driven in part by the amount of market reform and the challenges of budgeting projects that are not adequately defined. Here we take a look at how AEMO’s costs have escalated, proposed changes to the allowable revenue framework, and what can be done to keep a lid on costs.
Retail protection reviews – A view from the frontline
The Australian Energy Regulator (AER) and the Essential Services Commission (ESC) have released separate papers to review and consult on changes to their respective regulation around payment difficulty. Many elements of the proposed changes focus on the interactions between an energy retailer’s call-centre and their hardship customers, we visited one of these call centres to understand how these frameworks are implemented in practice. Drawing on this experience, we take a look at the reviews that are underway.
Send an email with your question or comment, and include your name and a short message and we'll get back to you shortly.