

by Carol Tran
Australia’s Home Battery Surge: A Question of Equity
Australia is a global leader in rooftop solar adoption, with more than 4.3 million households and small businesses installing photovoltaic (PV) systems as of Feb 2026. Rooftop battery installations in Australia have also experienced significant growth in recent years, particularly following the introduction of financial incentives like the Cheaper Home Batteries Program in July 2025 which saw solar batteries become eligible for small-scale technology certificates under the Small-scale Renewable Energy Scheme. With a discount of around 30 per cent on the upfront cost for any systems from 5 kWh to 100 kWh, more than 236,000 batteries have been installed since the launch of the program.
However, due to the 12-month reporting lag associated with certificate creation in data published by the Clean Energy Regulator, this figure likely understates the true number of installations and should be treated as an estimate. The Federal Government has indicated that installations have continued to grow, with more than 250,000 batteries installed as of March 2026.
Despite this rapid uptake, an important question still remains: Who actually benefits from these subsidies?
While battery rebate programs are designed to accelerate adoption, they may disproportionately benefit households with greater financial capacity to afford upfront costs, even after subsidies. This raises concerns about equity and the distributional impacts of energy transition policies.
This article will draw on postcode-level data using the Socio-Economic Indexes for Areas (SEIFA - based on census data) with scale from Advantage to Disadvantage to access the socioeconomic distribution of battery uptake since the program launched. It is worth noting that SEIFA measures measure the average characteristics of everyone living in the area rather than individual characteristics. Given the next 2026 Census data will not be published until 2028, the 2021 Census data is the most currently available for this analysis. Though some postcodes may have changed significantly in the past five years ago, particularly fast-growing outer suburban areas, 2021 still provides a great overview for assessing the geographic equity of the battery program uptake.
Figure 1: Battery Installations by SEIFA Decile across the nation since Cheaper Home Batteries Program launched (from July 2025 to Feb 2026)
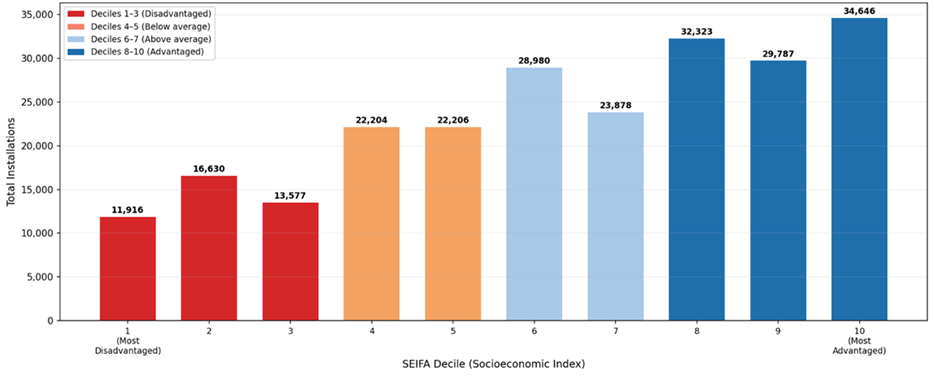
Source: Australian Energy Council’s analysis based on CER data as of 16 March 2026 & ABS
Decile 1 = most disadvantaged 10 per cent of areas nationally, decile 10 = most advantaged 10 per cent. If battery installations are concentrated in decile 10, that says they’re installed in the top 10 per cent most advantaged postcodes in Australia.
When ABS calculates SEIFA deciles, it ranks all postcodes nationally, including remote and regional areas with very high disadvantage.
Other than Tasmania, a clear pattern can be observed across every state with installations increasingly concentrated in higher deciles (see table 1). This shows a clear imbalance in adoption. Households in the most advantaged areas (deciles 8-10) account for 41.0 per cent of all installations, significantly higher than any other groups. In comparison, nationally, disadvantaged areas (deciles 1-3) represent only 17.8 per cent, while below-average (deciles 4-5) and above-average (deciles 6-7) groups account for 18.8 per cent and 22.4 per cent, respectively.
Table 1: Proportion of total battery installations by SEIFA Deciles
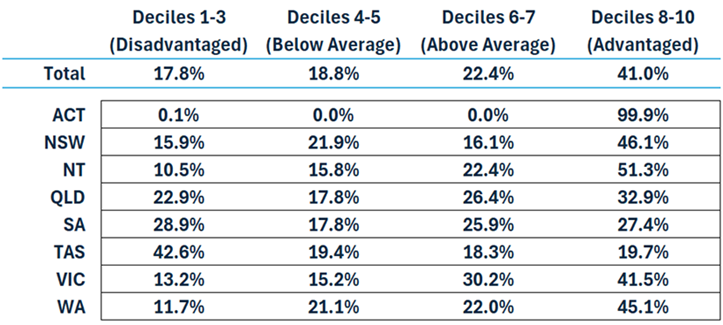
Source: Australian Energy Council’s analysis based on CER data as of 16 March 2026 & ABS
The equity gap can also be seen in system size (figure 2). Households in the lowest socioeconomic areas (deciles 1 - 3) install batteries averaging 22.3 to 22.9 kWh, compared to 24.8 to 25.6 kWh in the most advantaged areas (deciles 8 -10) with a difference of around 2-3 kWh per system. Wealthier households are not only more likely to install batteries, but also install larger battery systems, capturing greater storage capacity and higher bill savings. This points to a secondary equity gap alongside unequal access.
Figure 2: Average system size by SEIFA Deciles
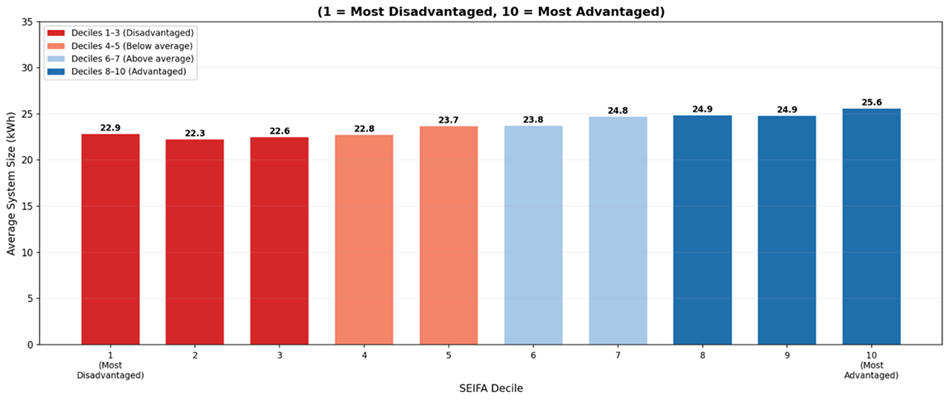
Source: Australian Energy Council’s analysis based on CER data as of 16 March 2026 & ABS
Across most states, Figure 3 shows that higher socioeconomic areas (deciles 8-10) consistently install larger battery systems. New South Wales and Queensland show the greatest difference, with decile 8-10 systems averaging 27 to 28 kWh compared to 24 to 25 kWh in lower socioeconomic areas. Victoria and South Australia display a similar but flatter trend. Western Australia has the largest relative gap nationally, with systems in lower socioeconomic areas averaging just 17.6 kWh versus roughly 20 kWh in higher socioeconomic areas. Tasmania shows smaller system sizes across all deciles.
Figure 3: Battery Installations and average system size by SEIFA Decile and by states (sort from highest to lowest installations)
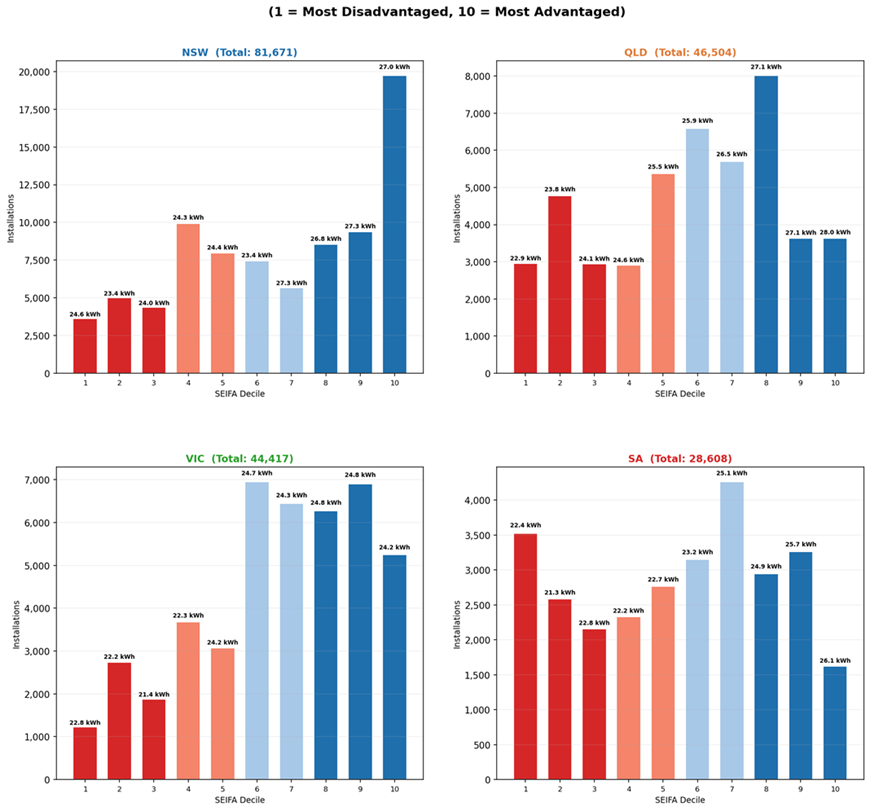
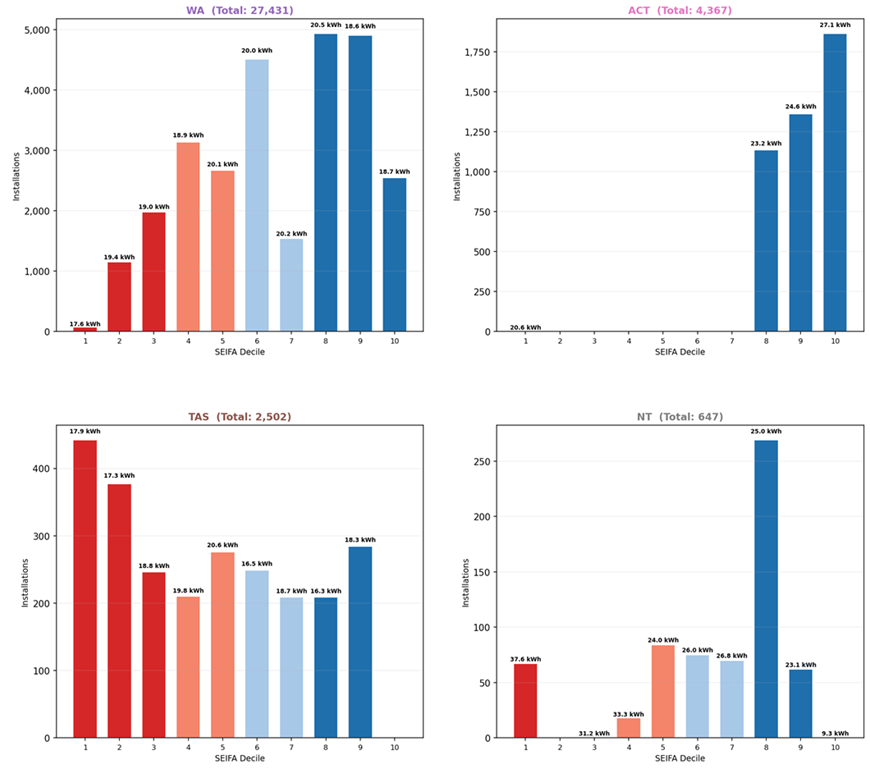
Source: Australian Energy Council’s analysis based on CER data as of 16 March 2026 & ABS
New South Wales, Victoria, and Western Australia together account for 65 per cent of national battery installations, yet all three show a pronounced socioeconomic skew. In each state, a disproportionate share of installations occurred in the top 30 per cent of advantaged areas (deciles 8-10) - 46.1 per cent in NSW, 45.1 per cent in WA, and 41.5 per cent in VIC.
Queensland presents a more balanced distribution, though uptake still skews toward wealthier areas. Notably, it has the highest share of installations among disadvantaged households (22.9%) of any large state, alongside a comparatively lower share in advantaged areas (32.9%), suggesting rebates have reached a broader cross-section of the community.
Queensland and South Australia have high shares of detached housing stock, 74.8 and 78 per cent respectively, making battery installation more accessible across all socioeconomic groups. Both states also have widespread rooftop solar uptake, and since the program subsidises battery add-ons to existing solar systems, this contributes to a more even distribution of installations.
South Australia shows the most even spread of any mainland state, with installations distributed across disadvantaged (28.9 per cent), below average (17.8 per cent), above average (25.9 per cent), and advantaged (27.4 per cent) areas. Two factors help explain this. First, high retail electricity prices create a strong financial incentive for households across all income levels to adopt batteries for bill savings. Second, South Australia's virtual power plant rebates are stackable with the federal rebate, further reducing payback periods - particularly lowering the barrier to entry for lower-income households.
Tasmania is the only state where disadvantaged postcodes account for the largest share of installations, at 42.6 per cent, and the lowest share in advantaged areas, at just 19.7 per cent (deciles 8–10). This likely reflects several factors, including relatively high home ownership rates even in lower-income and regional areas - 68 per cent in deciles 1–3, compared to 77 per cent in deciles 8–10 - alongside lower property prices, which make battery investment more accessible. Strong financial incentives from the rebate, particularly for households facing high electricity costs, also appear to be driving uptake.
The ACT's concentration of installations in upper deciles does not necessarily indicate inequitable distribution within the territory. As a high-income jurisdiction, driven largely by its concentration of federal public servants, defence personnel, and other professionals, no ACT postcodes fall below decile 8, meaning the upper-decile skew reflects the territory's demographic composition rather than unequal access.
The Northern Territory shows a skew toward advantaged areas (51.3 per cent) with a relatively low disadvantaged share (10.5 per cent). However, given the territory's small total number of installations, these figures should be interpreted with caution.
Combining battery installation data with socioeconomic indexes allows for an assessment of whether current policy settings are equitably supporting household access to clean energy technologies. While socioeconomic advantage is a key driver of battery adoption nationally, state-level factors, including policy settings, retail electricity prices, and housing characteristics ,play an important role in shaping uptake patterns. Tasmania, South Australia, and Queensland are the states where the program is achieving the most equitable outcomes, while NSW, Victoria, and Western Australia exhibit the largest equity gaps and represent the greatest need for targeted policy attention.
Related Analysis
South Australia’s election: a renewed Labor mandate or a history-making first for One Nation
As South Australia heads to the polls this Saturday, energy is shaping up as one of the key issues. The debate is being driven by two very different visions for the state’s future. Based on current polling, Peter Malinauskas’s Labor Government is expected to be re-elected, likely with an increased majority. However, it remains unclear who will form the opposition, with recent polling suggesting Pauline Hanson’s One Nation is currently favoured to take that role. This sets up the election as a clear comparison between two very different approaches to energy. Read more.
Clarity and understanding key ingredients for successful transition
The energy system is complex and decarbonising the grid adds further complexity. It requires significant new investment to ensure coal plants can exit without having an impact on the reliability of the grid. It comes with unavoidable costs and will take time to get right. It is increasingly important given this context that the energy transition is well understood. Selective framing of data to apportion blame works against a broad understanding and has the potential to undermine customer confidence and support for the transition. Read more.
A New Year: New regulated offer; new records but some old challenges
A new year has brought major developments across Australia’s energy markets, with new regulatory interventions alongside record-breaking renewable generation. The Federal Government’s Solar Sharer Offer marks a significant shift in retail market design, while the wholesale market delivered historic renewable output and much lower prices, driven largely by strong wind and growing battery capacity. We take a look at what these changes mean for customers, retailers and the reliability of the power system, and where old challenges continue to resurface.
Send an email with your question or comment, and include your name and a short message and we'll get back to you shortly.