

by Carl Kitchen
Assessing state-based renewable energy targets: US study
The Energy Policy Institute at the University of Chicago (EPIC) has released a working paper that assesses the value of state-based renewable energy targets (RET) in the United States. Its findings may come as a surprise to many given renewables are now widely seen as amongst the lowest cost forms of generation.
The paper “Do Renewable Portfolio Standards Deliver?” suggests that RETs, or renewable portfolio standards (RPS), which most consider have only had a minimal impact on electricity prices, actually have seen electricity prices increase “substantially” after RPS adoption. They also appear to achieve a small fraction of the carbon emission reductions per dollar of cost compared to cap-and-trade or emissions trading schemes.
This is based on assessing the cost of electricity for US states that have adopted targets (there are now 29, representing 62 per cent of US electricity generation) against states that have not adopted them.
Based on this approach (and what the authors claim is “the most comprehensive panel dataset ever compiled”) the costs exceed the marginal operational costs of renewables, reflecting the costs imposed on the generation system because of intermittency, higher transmission costs and any stranded asset costs assigned to consumers.
What is RPS?
RPS require electricity retailers to meet a percentage of demand from renewable sources. They typically increase over time until a specified amount of generation is reached. For example, the US’s largest state California has a 33 per cent target by 2020 and had interim targets of 20 per cent by 2013 and 25 per cent by 2016. In common with Australia’s RET, specific technologies are nominated and compliance is via renewable energy credits (REC) (or certificates in our case). Excess RECs can be banked and there is a fine for failing to have enough RECs.
The paper acknowledges that based on the common approach of considering the levelised cost of energy (LCOE) of a renewable energy plant versus a fossil fuel plant, renewables compare very well. The latest Energy Information Administration (EIA) data[i] suggests solar and wind plants can produce electricity at about 6 cents per kWh, while a natural gas combined cycle gas plant produces at roughly 4 cents/kWh in the US.
This comparison misses three key ways in which renewables impose costs on the electricity generation system that are reflected in retail prices, according to the EPIC analysis. These costs come from:
- Investments in new dispatchable capacity to protect against shortfalls and manage the intermittency of renewable generation. On average utility-scale solar plants have a capacity factor of about 25 per cent and wind plants are not much higher at 34 per cent, according to the EIA, so comparisons of LCOEs are very misleading because they do not account for the additional cost to supply electricity when renewables are not available. This is possibly also observed in Australia by renewables having difficulty selling electricity contracts that provide retailers firm protection against the spot price without also incorporating some kind of dispatchable source. This significantly diminishes the market value of a purely intermittent source, despite the attractive LCOE..
- Renewables require ample physical space and are often geographically dispersed, and located away from population centres, which requires transmission lines. The EPIC paper notes that in the US the Lawrence Berkeley National Laboratory found a median estimate of about $300/kW or about 15 per cent should be added to overall wind capital costs. EPIC writes that the disproportionate share of transmission requirements for renewables relative to their share of generation highlights the importance of accounting for the associated costs as part of the total costs of renewable generation. This should be of no surprise in Australia, which is subject to very large transmission investment proposals led by the Australian Energy Market Operator’s Integrated System Plan. Serious proposals are underway to build Riverlink, Western Victorian 500kV lines and a second Bass Strait cable, which in total will come to several billion dollars.
- Premature retirements of baseload capacity and/or transmission infrastructure that serves non-renewables to reduce non-renewable production enough to meet RPS mandates. The report notes that part of the system costs from RPS can be the premature displacing of existing productive capacity, especially in a period of flat or falling demand. “Adding new renewables along with flexible dispatchable capacity to a mature grid infrastructure can create a glut of installed capacity and render some baseload plant redundant,” the report says.
This has been seen in the National Electricity Market in several areas, but is particularly relevant to the closure of South Australia’s Northern and Playford power stations. And as identified in Deloitte Access Economics' report Energy Markets and the Implications of Renewables, the retirement of dispatchable plants can push up wholesale prices even while near zero marginal cost renewables work to push down wholesale prices.
Carbon abatement costs
The Obama Administration pegged the social cost of carbon (defined as the monetised damages from the release of an additional tonne of carbon) at roughly USD51 in 2019 dollars and EPIC states that the costs of the RPS programs exceed the price of a permit to emit a ton of CO2 in all major cap-and-trade markets globally by an order of magnitude. EPIC estimates that when carbon reduction estimates are combined with the estimated impact on average electricity prices from the RPS, the cost per tonne of carbon abated is more than USD130
It also finds that whilst the cost are probably larger than the social cost of carbon, it acknowledges that RPS policies may dynamically reduce the cost of abatement in future by bringing about improvements in renewable technology. They also accept that the calculations used may understate the social cost because it only reflects the portion borne by consumers while some will be borne by generators or transmission companies.
Further analysis
In contrast to EPIC’s analysis there has also been a review of the benefits and impacts of the US RPS, which points to the value of renewable targets in getting prices down. The most recent undertaken in 2016 by the National Renewable Energy Laboratory, a US government agency[ii]. This considered the impact of the 2013 obligations.
It assessed that the reduction of wholesale electricity prices as a result of new renewable generation achieved a saving of up to $1.2 billion for electricity consumers, equivalent to up to 1.2c/kWh. It also reported that the RPS had reduced gas demand, which reduced the average natural gas price by an estimated 5 to 14 c/MMBtu with consumer savings equivalent to 1.3-3.7c/kWh.
That analysis notes that it adjusted the wholesale prices for two factors – the decay factor and the extent to which retail electricity bills are exposed to wholesale prices.
The first adjustment reflects the fact that the impact of RPS generation may erode over time – this is based on reduced incentives for generators to enter the market or for existing generators to stay in operation. Over time, the market will adjust as lower wholesale prices delay new entrants and accelerate the closer of some plants, which will drive prices back up. Over time it notes that with higher levels of variable generation, the overall mix will shift away from technologies with high upfront costs and low variable costs (such as coal-fired power stations) towards plants with lower upfront costs and higher variable costs (such as gas-fired peaking plants), which in the longer term means that the extent of wholesale price reductions could dissipate.
Overall it found the key benefits of the RPS to be:
- GHG emissions and climate change damage reduced – calculated at $2.2bn of global benefits when applying a central value of $37/tonne for the social cost of carbon, equivalent to 2.2 cents/kWh.
- Air pollution emissions and human health and environmental benefits – it estimated the benefits to be $5.2bn on average, equivalent to 5.3c/kWh
- Water use reduction – national water withdrawals and consumption was reduced by 830 billion gallons (3.1 trillion litres) and 27 billion gallons (102 billion litres), respectively.
Other impacts associated with new renewables included gross jobs and economic development. The NREL estimated nearly 200,000 jobs and $20 billion in GDP. Around 30,000 jobs were in ongoing operations and maintenance and the rest in construction (see Figure 1).
Figure 1: Benefits and impacts of US RPS
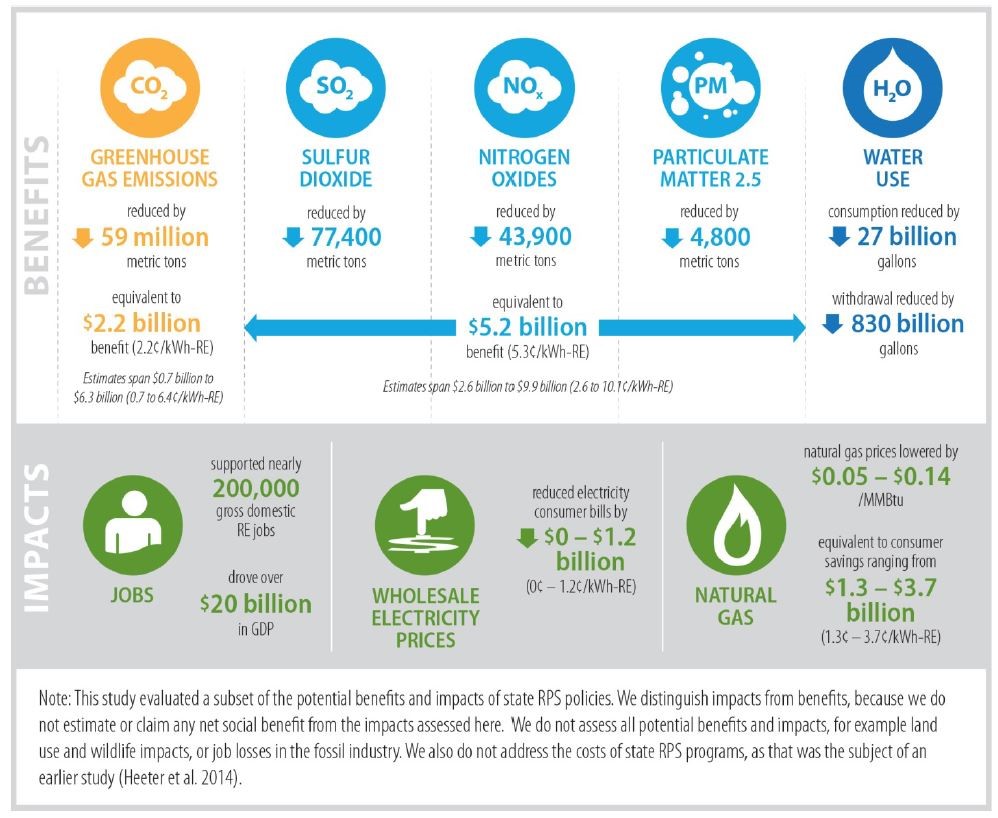 Source: NREL
Conclusion
In the absence of an overall Federal policy position, states – both here and overseas have taken up targets to encourage decarbonisation of the energy system. The Pew Center [iii] found that RPS were often introduced and expanded for reasons beyond carbon emission reductions with factors like economic development benefits, such as jobs from encouraging renewable generation and developing localised energy sources playing a part. Similar motivations are cited by Australian states in pursuing state-based RETs.
Collectively, the literature suggest that RPS is not as optimal as a national approach or cap-and-trade or emission trading schemes which can achieve lower emissions at lower cost to the economy.[iv]
The cost benefit analysis of renewables and particularly the mandating of levels of renewable technologies in the shift will continue to be debated here and overseas. Community support for renewables makes targets and policies aimed at fuelling the further take up of renewables politically attractive.
[i] Energy Information Administration, Annual Energy Outlook, 2019
[ii] A Retrospective Analysis of the Costs, Benefits, and Impacts of U.S. Renewable Portfolio Standards, National Renewable Energy Laboratory and Berkeley Laboratory, 2016
[iii]https://web.archive.org/web/20120913070544/http://www.c2es.org/docUploads/RPSReportFinal.pdf
[iv]https://publicpolicy.wharton.upenn.edu/live/news/682-renewable-portfolio-standards-state-variation-at
Related Analysis
Wild Cards: Could these technologies advance the energy transition?
In December 2022, scientists at the National Ignition Facility achieved a landmark nuclear fusion result: a reaction that produced more energy than the laser pulse used to start it. It made headlines globally, but the caveats came quickly. Overall system energy use was still far higher, and commercial viability remains decades away. It was a real breakthrough, but also a reminder of how far the engineering still has to go. That gap between scientific progress and commercial reality is a defining feature of the energy transition today. While solar, wind, and batteries are scaling rapidly and doing most of the heavy lifting, the International Energy Agency estimates that nearly half of the emissions reductions needed for net zero will depend on technologies still at demonstration stage or earlier. This raises the key question: which “wild card” technologies could help close that gap?We take a look.
The ‘f’ word that’s critical to ensuring a successful global energy transition
You might not be aware but there’s a new ‘f’ word being floated in the energy industry. Ok, maybe it’s not that new, but it is becoming increasingly important as the world transitions to a low emissions energy system. That word is flexibility. The concept of flexibility came up time and time again at the recent International Electricity Summit held in in Sendai, Japan, which considered how the energy transition is being navigated globally. Read more
Nuclear Fusion Deals – Based on reality or a dream?
Last week, Italian energy company ENI announced a $1 billion (USD) purchase of electricity from U.S.-based Commonwealth Fusion Systems (CFS), described as the world’s leading commercial fusion energy company and backed by Bill Gates’ Breakthrough Energy Ventures. CFS plans to start building its Arc facility in 2027–28, targeting electricity supply to the grid in the early 2030s. Earlier this year, Google also signed a commercial agreement with CFS. These are considered the world’s first commercial fusion-power deals. While they offer optimism for fusion as a clean, abundant energy source, they also recall decades of “breakthrough” announcements that have yet to deliver practical, grid-ready power. The key question remains: how close is fusion to being not only proven, but scalable and commercially viable, and which projects worldwide are shaping its future?
Send an email with your question or comment, and include your name and a short message and we'll get back to you shortly.