

by Justine Lovell
Are we on the road to clean energy progress?
A recent assessment of 18 energy-related technologies found that solar PV made “tremendous progress” in 2017, with record deployment across the globe.
The findings are part of the IEA’s annual Tracking Clean Energy Progress that assesses deployment rates, investment levels, and innovation needs across a range of energy technologies and sectors that it considers are critical to achieve a transition to lower emissions[i].
Last week we looked at the IEA’s assessment of gas, coal-fired and nuclear power generation. Here we expand further and take a look at what the IEA assessment found for solar, wind, and carbon capture, utilisation and storage (CCUS) generation.
Tracking Progress
In its annual assessment, the IEA tracks how each technology is moving towards the agency’s own Sustainable Development Scenario (SDS). The SDS was developed to outline the scale of the transformation needed to reach the Paris Agreement’s “well below 2°C” climate target.
The IEA found that in 2017, most of the technologies were not on course to meet reduction targets and that this contributed to a global increase in carbon emissions of 1.4 per cent.
Solar PV is the only energy-related technology rated “on track” to meet long-term climate, energy access and air pollution goals. CCUS remains stalled, and onshore wind and energy storage were downgraded last year as their progress slowed. Technologies significantly “not on track” included coal-fired generation.
Solar
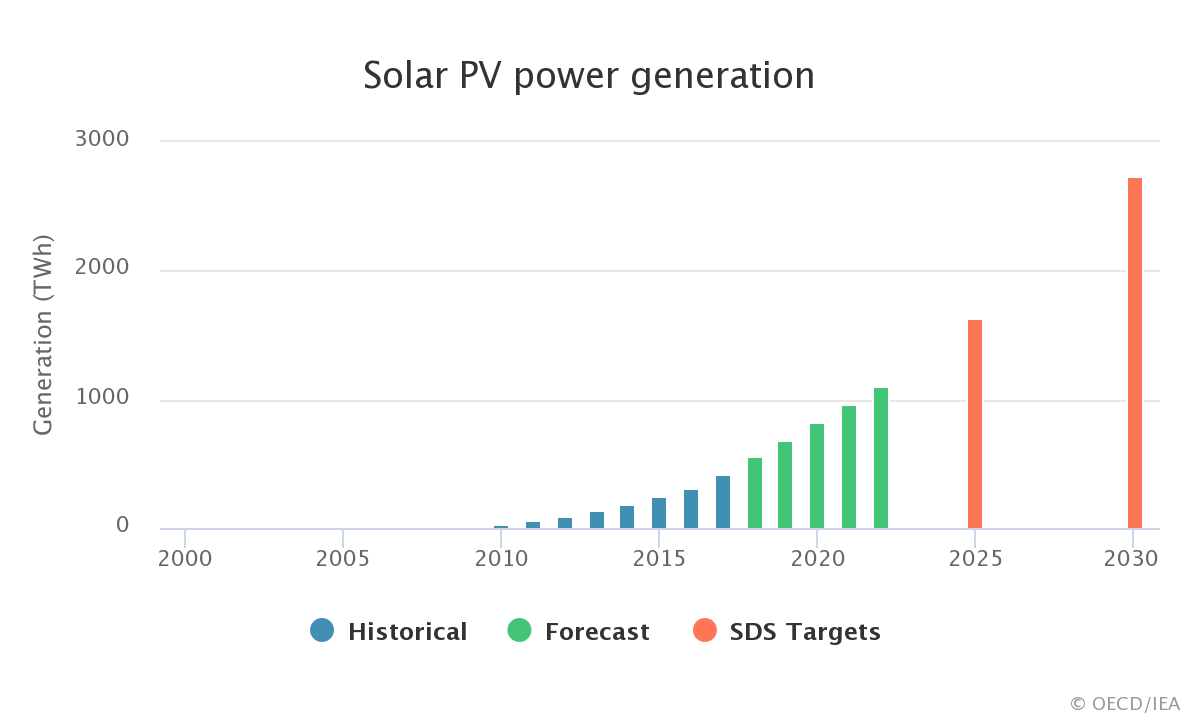
Solar PV led the growth in renewable power generation in 2017 - increasing by a record 34 per cent. It is “well on track” to meet the agency’s target of an average annual growth of 17 per cent to 2030 (Figure 1).
Figure 1
 Source: IEA
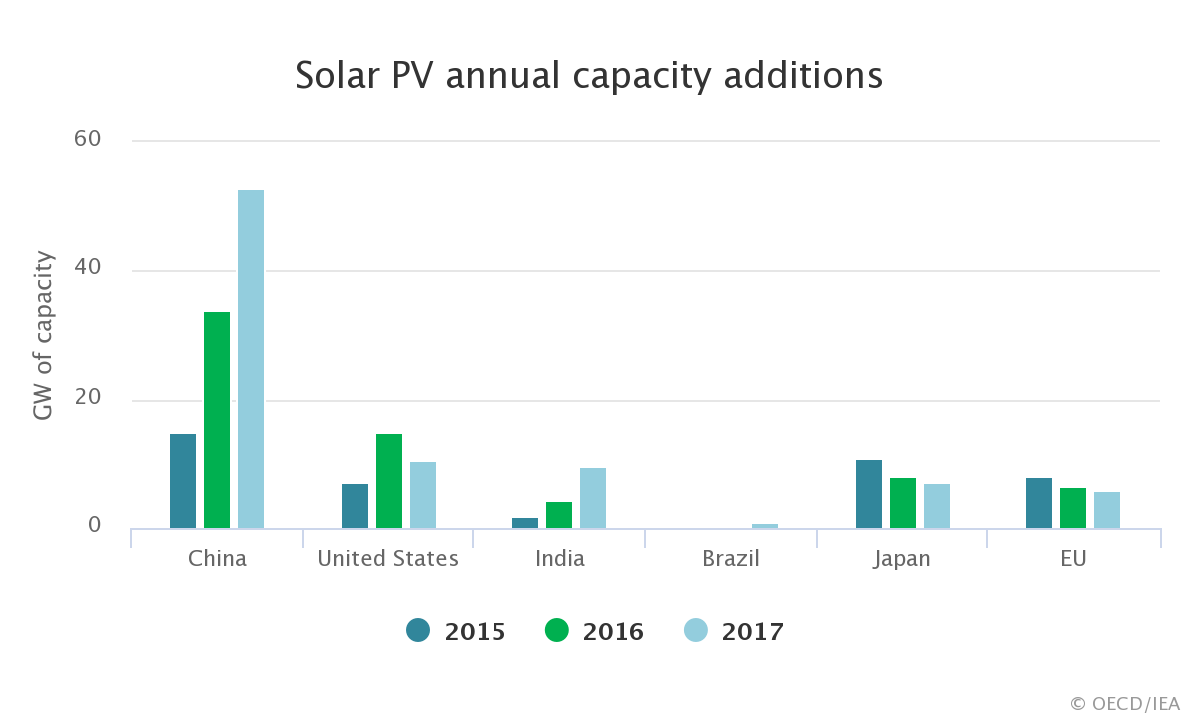
Solar PV generation increased by over a third in 2017, representing almost 2 per cent (up to 416TWh) of the world’s total electricity generation. This growth has been led by a deployment “boom” in China (Figure 2), which is due to falling prices and feed-in tariffs.
Of last year’s total growth of 95-98 GW, China deployed 53 GW of capacity. China’s share of global PV demand has increased from 10 per cent in 2012 to more than 55 per cent in 2017.
Figure 2
 Source: IEA
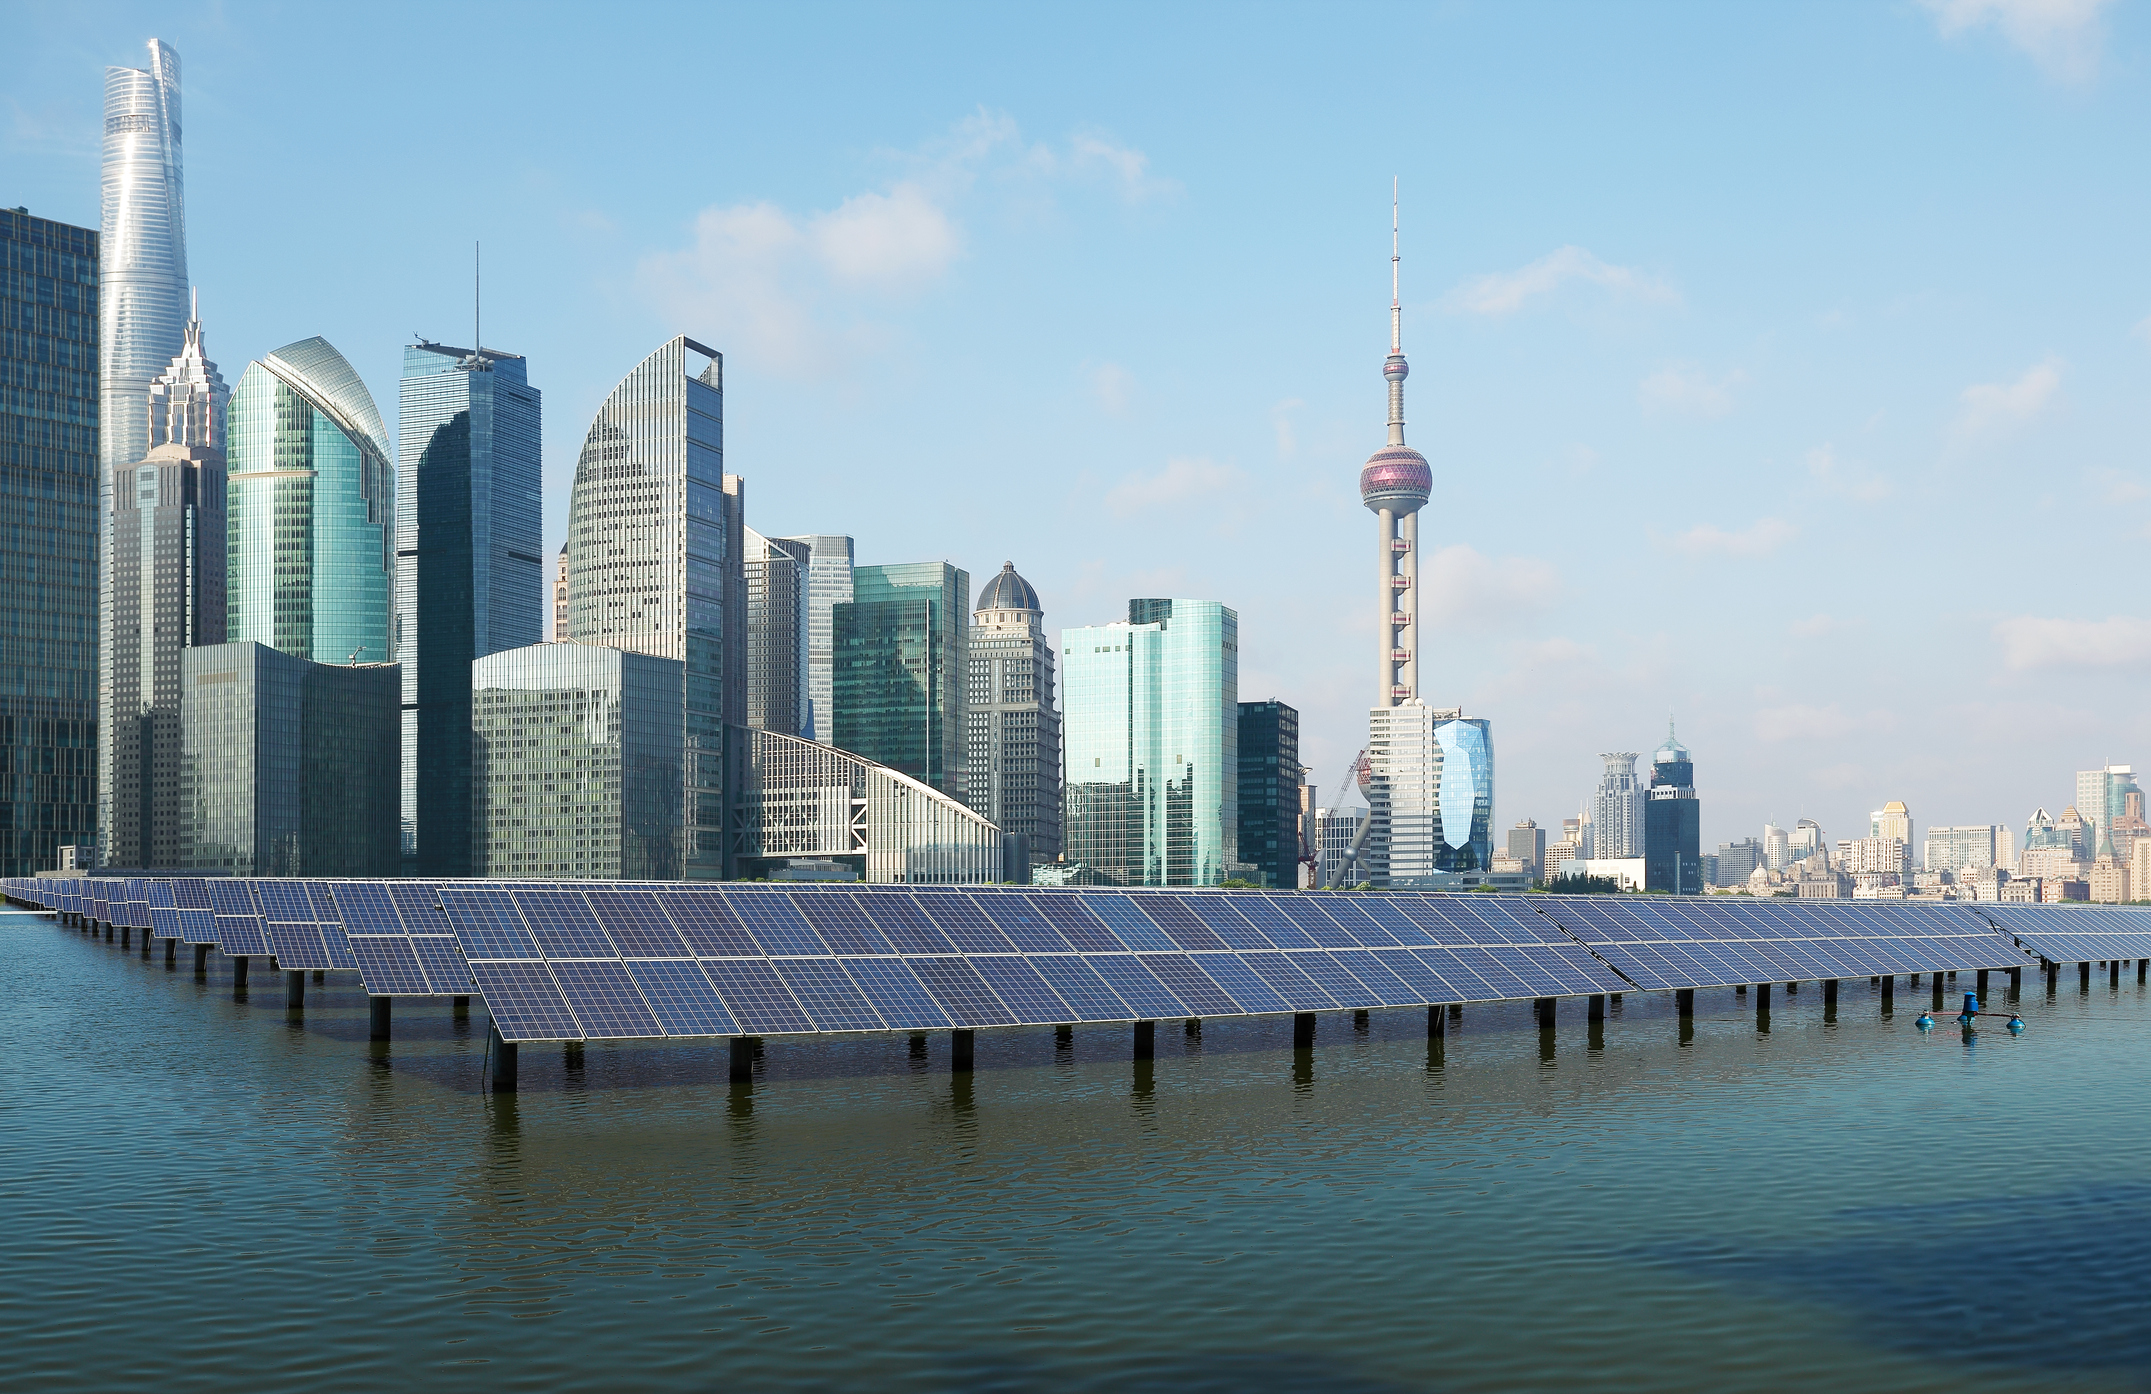
Shanghai Bund skyline
The United States remains the second-largest PV market, even with a decline in its capacity additions by almost 30 per cent, to 10.6 GW, in 2017. New import tariffs may slow down growth in the United States in the short-term, but according to the IEA, the long-term market looks “robust”.
India emerged as key player in 2017, where annual PV additions more than doubled to 9.6 GW in 2017. In Japan, capacity growth slowed by 12 per cent to 7 GW, while annual additions were just under 6 GW in the European Union.
The IEA estimates that since 2010, prices for new solar PV large utility-scale systems have fallen by 70 per cent, and even with the costs of new installations declining by 13 per cent in 2017, the same year saw solar PV investment peak at USD145 billion.
This decline in PV prices is expected to continue as competition and manufacturing increases in China and South East Asia. The IEA notes that these cost reductions, along with policy support and China’s boom, are expected to steer a rapid expansion in solar PV over the next five years.
Wind
The IEA found that both onshore and offshore wind require “more effort” to reach the agency’s SDS target.
Onshore
Last year onshore wind was downgraded from its “on-track” status, as progress slowed for a second consecutive year. Onshore wind capacity additions declined by 10 per cent in 2017, while the SDS target requires annual generation growth of 12 per cent to 2030.
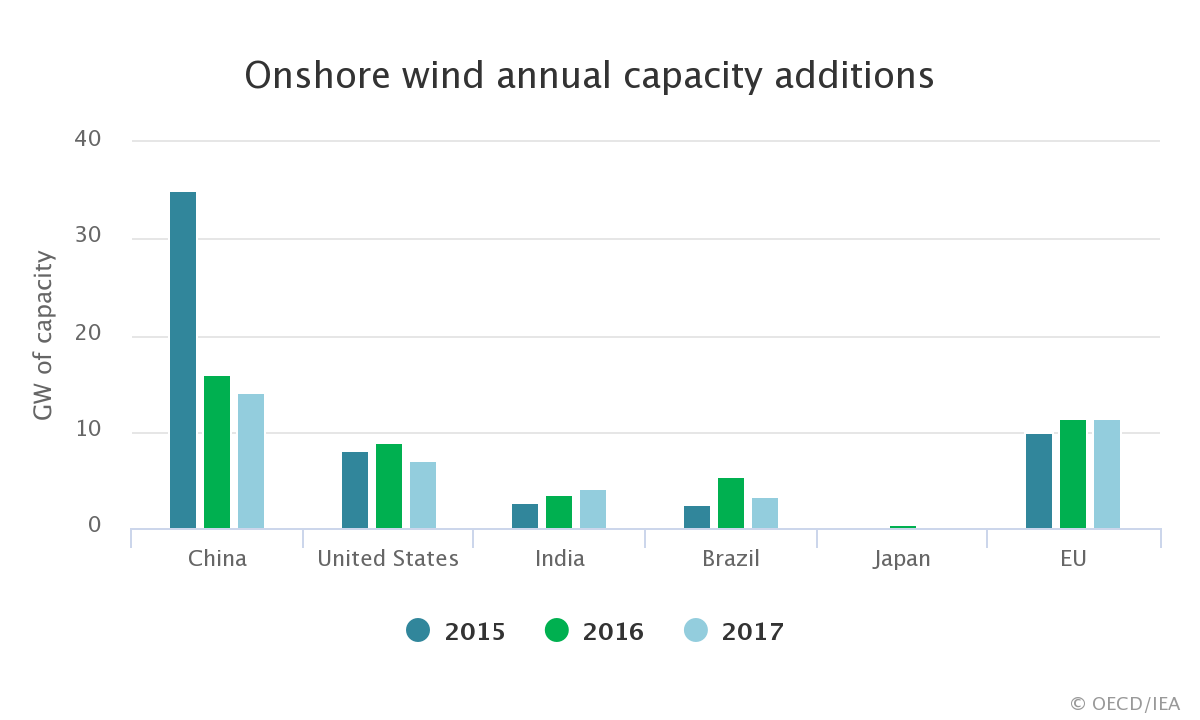
Last year grid-connected onshore wind capacity additions declined to around 44 GW, from 56GW in 2016 and 65GW in 2015. Onshore capacity additions need to grow by 5 per cent annually to meet the target of 90 GW in 2030.
Figure 3
 Source: IEA
In 2017 China connected over 14 GW of new onshore wind capacity, slightly lower than 2016 and well below its peak in 2015 (Figure 3). The European Union connected 11.5 GW of capacity, which was mainly driven by France, Germany and the United Kingdom. In the United States, capacity additions decreased by 15 per cent, while India connected 4.1 GW of capacity.
In terms of new investment, onshore wind plants fell by nearly 15 per cent in 2017 to around USD 70 billion. Part of this spending drop comes from lower costs, which dropped by around 5 per cent.
The IEA does not foresee a rebound in the short term for China’s onshore wind market due to a government ban on new developments in six northern regions because of “curtailment problems”. The United States also shows challenging market conditions with the phase-out of tax credits, which may limit financing in the medium term.
India is expected to have capacity growth, but the IEA notes that “operational and grid integration problems” are inhibiting plants from operating at full capacity, while in Europe, there is policy uncertainty over wider 2030 renewable energy targets.
Offshore
Offshore wind showed more positive signs of progress with 23 per cent generation growth in 2017, however the IEA notes it needs to grow faster to meet the SDS target.
In 2017 grid-connected offshore wind capacity additions reached almost 4 GW, led by China, Germany and the United Kingdom.
Figure 4
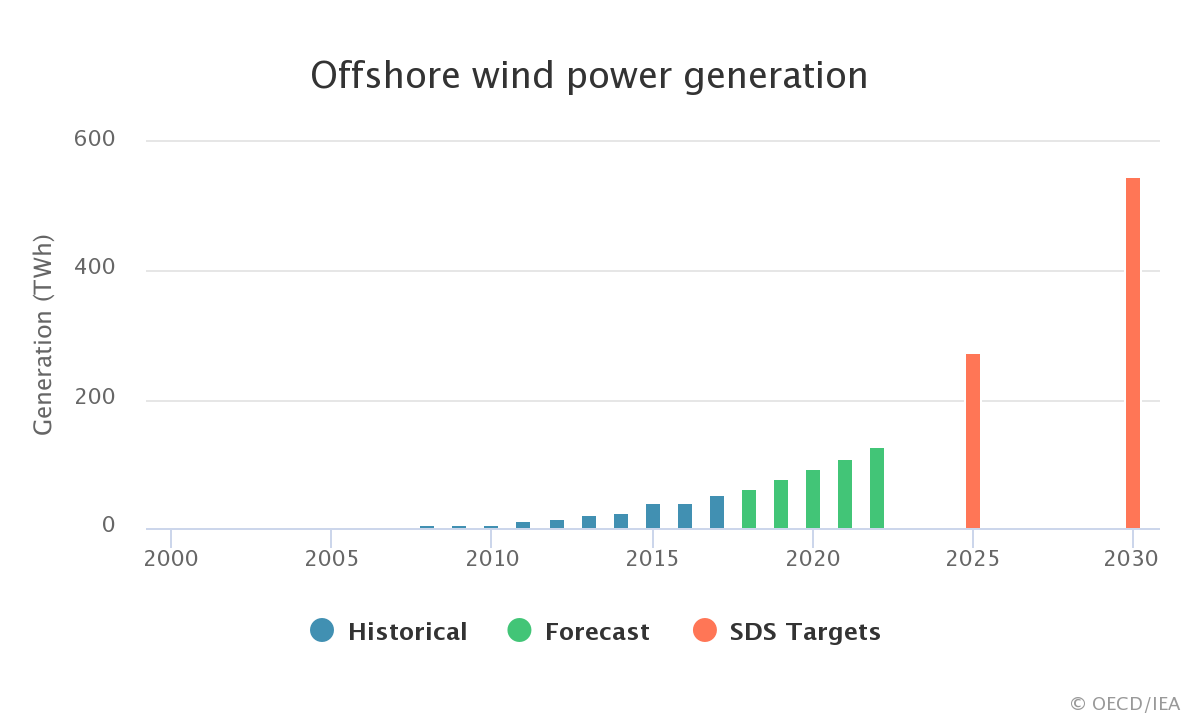 Source: IEA
Due to growth in Europe and China, offshore wind investment peaked in 2017 to over USD 15 billion, and the IEA notes that cost reductions of 30-50 per cent are possible over the medium term in the European Union: “Larger turbines reduce construction costs, and larger projects bring economies of scale, standardisation and clustering.”
While offshore wind is not currently on track to meet the agency’s target, new technology, cost and market trends show progress. Deployment has recently increased in China, which is expected to grow strongly. In the European Union, growth will depend on the final approval of its wider 2030 renewable energy targets.
Carbon capture, utilisation and storage
The IEA describe CCUS in power as “far off track” to reach the SDS target of 350 million tonnes per year by 2030.
By the end of 2017, only two CCUS power projects - Petra Nova in Texas and Boundary Dam in Canada - were in operation with a total annual capture capacity of 2.4 million tonnes of CO2.
Figure 5
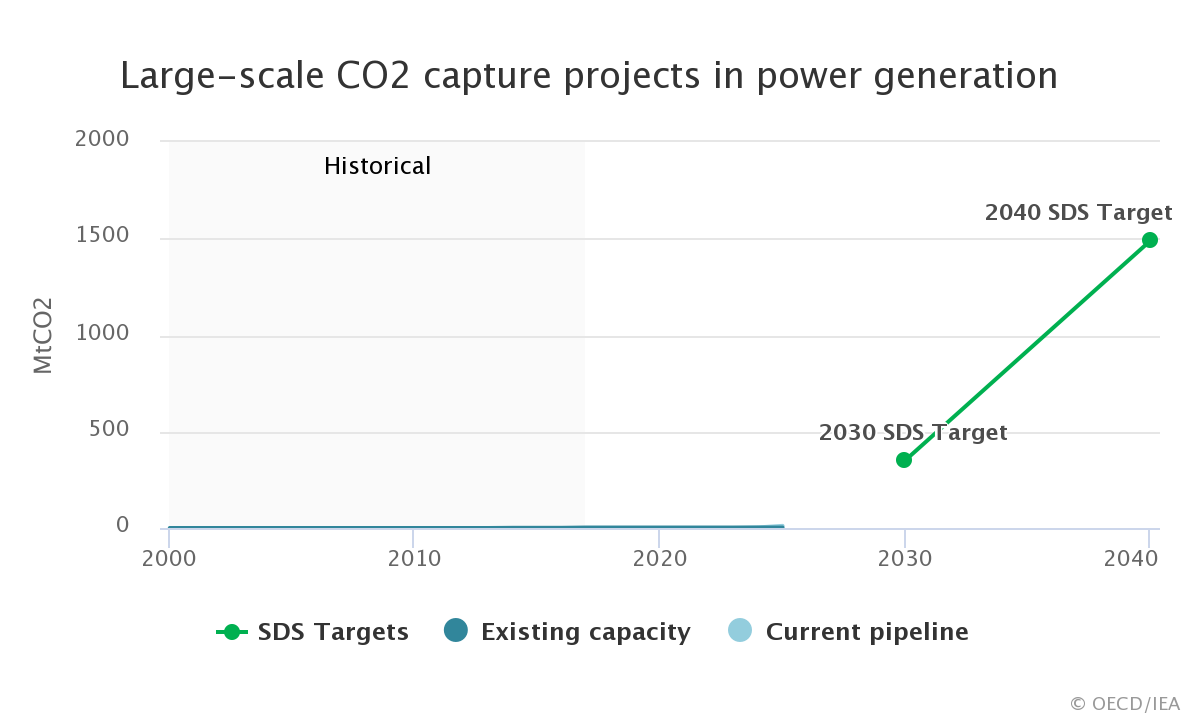 Source: IEA
Petra Nova began operation at the beginning of 2017, as the largest retrofitted post-combustion carbon capture system installed on a coal-fired power plant. However in the same year, Mississippi’s Kemper County Energy Facility suspended its CCUS operations after several billion dollars of investment.
Despite this, the IEA notes that Petra Nova and Boundary Dam (which has been operating since 2014) are supporting future cost reductions. Meeting the agency’s ambitious 2030 target will require reducing costs and improving technology - and the capital and operating costs of next generation plants are now expected to be 25-30 per cent lower.
Currently there are four CCUS power generation projects in early development in China, two in Korea and one in the United Kingdom. Potentially these projects, together with Petra Nova and Boundary Dam, will have a combined capture capacity of around 13 Mtpa - however this rate, and the number of projects receiving final investment decisions, would need to increase extraordinarily to meet the 2030 target of 350 Mtpa CO2 captured from power generation.
The IEA notes that the two operational plants are a good example of a retrofit option for existing plants, given the ongoing construction of unabated coal units particularly in Asia. It says retrofitting plants with CCUS could “solve economic and emissions problems, by allowing plants to be operated while recovering their investments and reducing their carbon footprints.”
[i] Tracking Clean Energy Progress, International Energy Agency
Related Analysis
Climate and energy: What do the next three years hold?
With Labor being returned to Government for a second term, this time with an increased majority, the next three years will represent a litmus test for how Australia is tracking to meet its signature 2030 targets of 43 per cent emissions reduction and 82 per cent renewable generation, and not to mention, the looming 2035 target. With significant obstacles laying ahead, the Government will need to hit the ground running. We take a look at some of the key projections and checkpoints throughout the next term.
Certificate schemes – good for governments, but what about customers?
Retailer certificate schemes have been growing in popularity in recent years as a policy mechanism to help deliver the energy transition. The report puts forward some recommendations on how to improve the efficiency of these schemes. It also includes a deeper dive into the Victorian Energy Upgrades program and South Australian Retailer Energy Productivity Scheme.
2025 Election: A tale of two campaigns
The election has been called and the campaigning has started in earnest. With both major parties proposing a markedly different path to deliver the energy transition and to reach net zero, we take a look at what sits beneath the big headlines and analyse how the current Labor Government is tracking towards its targets, and how a potential future Coalition Government might deliver on their commitments.
Send an email with your question or comment, and include your name and a short message and we'll get back to you shortly.