

by Duncan MacKinnon
WA: 2017 ESOO report highlights
The Australian Energy Market Operator (AEMO) recently published the 2017 Electricity Statement of Opportunities (ESOO) for the Wholesale Electricity Market (WEM). We take a look at the report, which provides projections on Western Australia’s supply-demand balance.
WA's Wholesale Electricity Market
The WEM operates in the 261,000km2 South West Interconnected System – the region of Western Australia which extends from Kalbarri in the north, to Albany in the south, and to Kalgoorlie in the east. It also includes the Perth metropolitan area.
The WEM differs from the National Electricity Market (NEM) in the following key ways:
- Reserve Capacity Mechanism: A market mechanism to ensure that there is adequate generation and demand side management (DSM) capacity available each year to meet peak system requirements and achieve the reliability targets specified in the WEM Rules; and,
- Short Term Energy Market: A day-ahead market for energy that allows Market Participants to trade around their bilateral energy positions, thereby recovering their short run marginal costs.
The WEM has a sharper peak than the NEM, with the upper 33.2 per cent of the load used for 10 per cent of the time, compared to 19.9 per cent of the time in the NEM. The minimum load in the WEM is 34.7 per cent of peak demand, which is lower than the NEM (48 per cent).[1]
Capacity Diversity
Currently 76 units are assigned capacity credits in the WEM, comprising 48 scheduled generators, 18 non-scheduled generators and nine DSM facilities.
DSM market share has fallen from 10 per cent in 2016-17 to 2 per cent in 2017-18, primarily as a result of the State Government’s Electricity Market Review[2]. It found that DSM resources enter the market under more favourable terms than electricity generation resources, and recommended that all capacity resources face availability and measurement requirements that are broadly equivalent.
The level of capacity credits allocated to renewable generation was at its highest in 2011–12, reaching approximately 4 per cent of market share. The implementation of the new “relevant level” calculation methodology from 2012, intended to reflect renewables’ contribution to peak demand more accurately, reduced this to around 2 per cent of market share from 2014–15.
There is 1,781MW of coal-fired generation, of which approximately 12 per cent is more than 50 years old, 45 per cent is between 30 and 40 years old, and 42 per cent less than 20 years old – as shown in Figure 1.
Figure 1: Facilities operating in the SWIS by age, fuel capability and capability classification
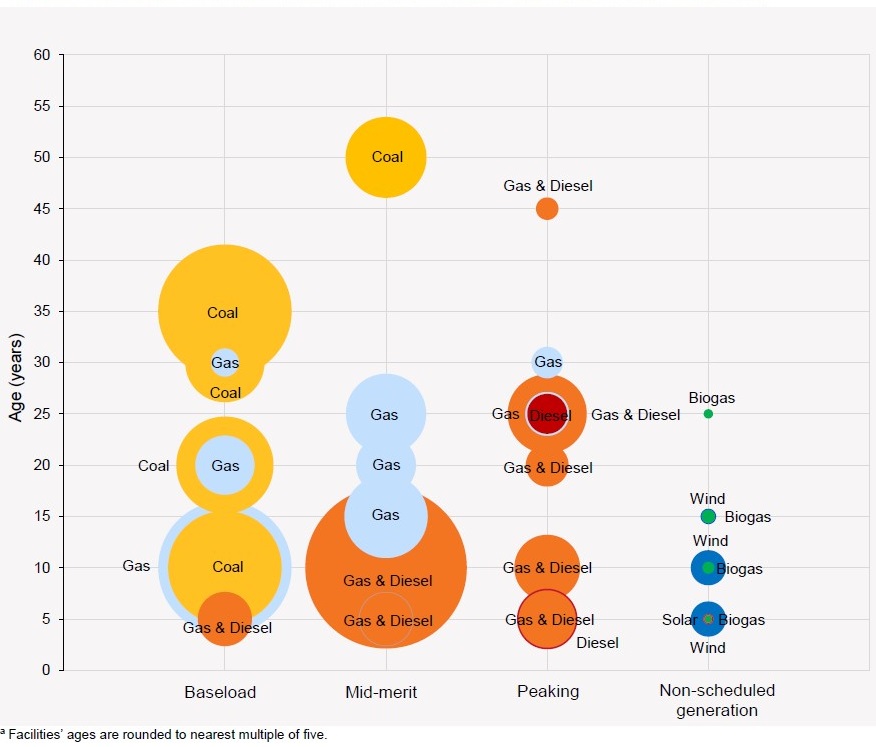
Source: AEMO (2017)
Of course small-scale photovoltaic (PV) systems also provide some supply (or alternatively, reduced demand) and grew from 60,913 installations in 2010-11 to 200,133 installations (about 670MW) in January 2017. Roughly one in four residential customers in WA now has a rooftop PV system installed.
These PV systems have changed the shape of the daily demand profile, by reducing demand and shifting the timing of peak demand. Figure 2 illustrates this change.
Figure 2: Daily daytime demand profiles for peak days 2007-08 and 2016-17
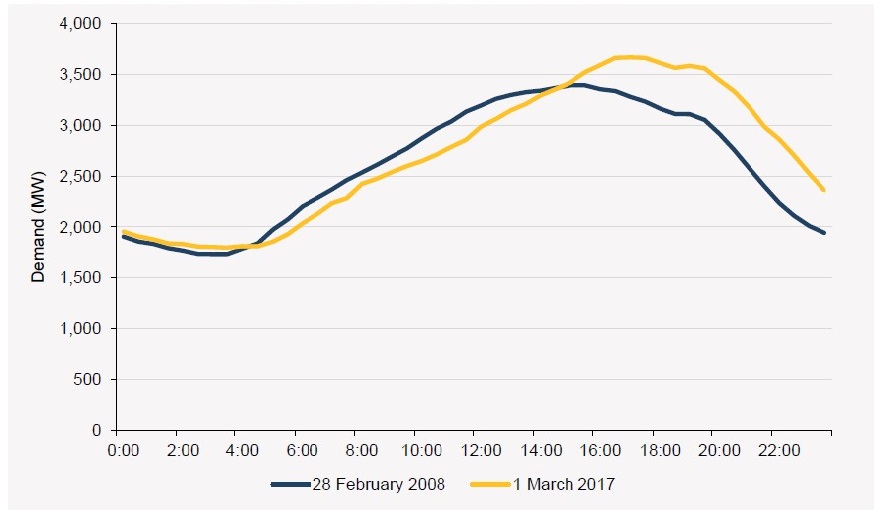
Source: AEMO (2017)
The effect is more pronounced in winter, and AEMO observes, “This new pattern may require gas peaking generation to start and stop multiple times during the day, potentially increasing generation costs and, subsequently, wholesale energy prices. In particular, fast-response gas peaking generation may be dispatched outside of the balancing merit order more frequently in the future to cater to a sharper ramp-up of load between 16:00 and 18:00.”[3]
Peak Demand
The report concludes that peak demand will continue to grow, primarily due to economic growth and population growth. Rooftop PV and battery storage will reduce demand, and variables like weather, the uptake of electric vehicles and the expansion (or closure) of industrial facilities will also have material effects, but cannot be accurately modelled. Figure 3 illustrates the report’s forecast.
Figure 3: Historical and forecast peak demand, 10% POE, 2010-11 to 2026-27
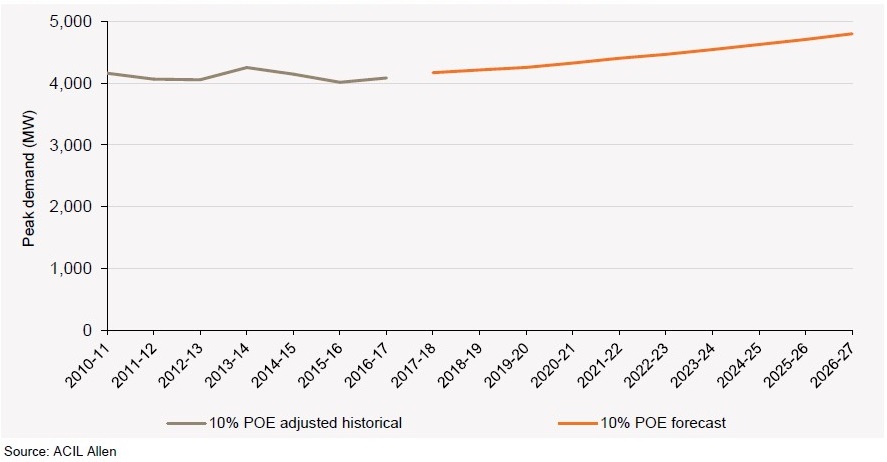
Sourced from: AEMO ESOO (2017)
Supply-Demand Balance
Based on these peak demand projections, the supply-demand balance is sufficient for the next few years, but as the following table[4] shows, the margin of excess capacity reduces quickly as plant retires.
Table 1: Capacity projections and margins of excess capacity
|
All figures in MW unless specified |
2016-17 |
2017-18 |
2018-19 |
2019-20 |
|
Existing Generating Capacity |
5,058 |
5,088 |
4,701 |
4,701 |
|
Existing DSM Capacity |
560 |
106 |
106 |
106 |
|
Retired Capacity |
122 |
0 |
387 |
0 |
|
Committed New Capacity |
18 |
12 |
0 |
0 |
|
Proposed Projects |
0 |
0 |
16 |
152 |
|
Total Capacity |
5,618 |
5,194 |
4,807 |
4,807 |
|
Excess Capacity |
1,061 |
642 |
187 |
147 |
|
Excess Capacity (%) |
23.3% |
14.1% |
4.0% |
3.2% |
Source: AEMO (2017)
Conclusion
The report shows that the Western Australia electricity market is currently in good shape, although planning will need to ensure that sufficient capacity remains, as surplus capacity dwindles and scheduled generation is replaced by either behind-the-meter PV or non-scheduled generation.
[1] Australian Energy Market Operator, June 2017, 2017 Electricity Statement of Opportunities for the Wholesale Electricity Market, p.15
[2] Department of Finance – Public Utilities Office, 7th April 2016, Electricity Market Review Final Report: Reforms to the Reserve Capacity Mechanism
[3] AEMO (2017), p. 33.
[4] AEMO (2017), p. 61
Related Analysis
Is increased volatility the new norm?
This year has showcased an increased level of volatility in the National Electricity Market (NEM). To date we have seen significant fluctuations in spot prices with prices hitting both maximum price caps on several occasions and ongoing growth in periods of negative prices with generation being curtailed at times. We took a closer look at why this is happening and the impact this could have on the grid in the future.
Is there a better way to manage AEMO’s costs?
The market operator performs a vital role in managing the electricity and gas systems and markets across Australia. In WA, AEMO recovers the costs of performing its functions via fees paid by market participants, based on expenditure approved by the State’s Economic Regulation Authority. In the last few years, AEMO’s costs have sky-rocketed in WA driven in part by the amount of market reform and the challenges of budgeting projects that are not adequately defined. Here we take a look at how AEMO’s costs have escalated, proposed changes to the allowable revenue framework, and what can be done to keep a lid on costs.
Offshore wind feasibility licenses have been granted – what are the proposals and who’s behind them?
The Federal Government has announced the first proposed offshore wind projects to receive a feasibility licence for development of generation in the Gippsland Offshore Wind Zone. We take a look at the proponents and projects.
Send an email with your question or comment, and include your name and a short message and we'll get back to you shortly.