

by Isobel Graham
The ebb and flow of demand management
The looming summer period has the electricity industry looking seriously at whether the system will be able to supply the needs of the grid. To address reliability concerns, an Energy Security Board has been established as recommended by the Finkel review.
Some outside the industry have suggested that electricity demand management should adopt some of the lessons learned from the drought responses employed in the mid2000s.[i] This crisis was resolved by making people more aware of water conservation, reducing leakage and introducing dual flush toilets and aerated water taps.[ii] While the calls for electricity demand management seem sensible and are not new, can the comparison between energy and water really be made? We take a look at some of the important differences between managing water and electricity demand.
Stock vs Flow
The most fundamental difference between electricity and water unsurprisingly stem from its differing physical properties. Of great importance is that one is a stock variable and one is a flow. Water as managed by entities such as Sydney Water can be described as a stock variable. It can be stored in dams for later use and the level of the stock is determined by the inflows and outflows. Electricity on the other hand is a flow variable. That is, demand and supply is instantaneously determined and there is no ‘stock’ of electricity that exists. The inability to store large amounts of electricity for later use causes the fundamental difference in their management. While dams store water for times of need even in low rain events, this is not economic for electricity.
Water demand management
There’s no doubt that the management of the early 2000s water crisis was effective. Figure 1 shows water use in Sydney from 1996-2014 and how restrictions and other water saving measures effectively reduced demand. It has been noted that the water saving measures saved around 10-15 per cent of water demand. This reduction in water demand had the effect of reducing outflows from the water stock, reducing pressure on the resource. While this achievement is enviable, it is not one that can be copied over to electricity for several reasons.
Figure 1: Water use in Sydney from 1996-2014
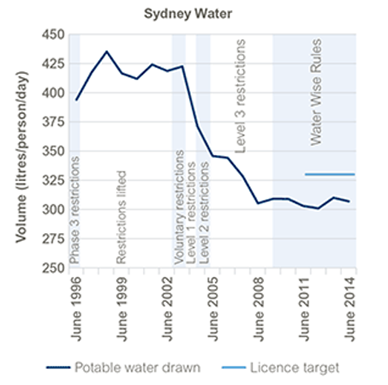
Source: NSW EPA 2017
Peak vs Average Demand
The main reason for the lack of comparison of demand management between water and electricity stems from the nature of stock vs flow variables. Quantities of stock variables are determined by their associated flows. In the case of a dam, the stock level is determined by the inflows from rivers and the outflows from evaporation and water use. Decreasing water use through water restrictions and improvements in water saving measures reduces the outflow and increases the level of the stock. Demand management does not have the same effect on electricity. Firstly, the electricity saved one day cannot be used the next unless it is stored, which is currently not economically viable on a large scale. Secondly, the critical parameter that determines the size of electricity generation and supply infrastructure is the maximum or peak instantaneous demand, not the average demand. This sets it apart from water as the time water is used is considered over a longer period such as a day and the primary concern is the total outflow compared with inflows which will determine dam levels.
Taking a look at demand patterns over the last decade or so, we can see a divergence between peak and average demand for some NEM states. Average demand for New South Wales, South Australia and Victoria are shown in Figures 2-4. Despite a slight increase in recent years, average demand is much lower than ten years ago and has shown a downward trend. This is due to a number of factors including the increased uptake of solar PV, reduced industrial load and energy efficiency programs, especially those focusing on more efficient appliances and lightbulbs.[iii]
Figure 2: Average Demand in NSW
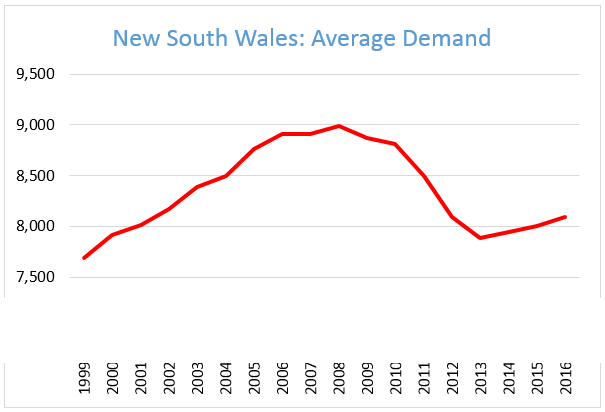
Source: NEM review and EGA Data
Figure 3: Average Demand in SA
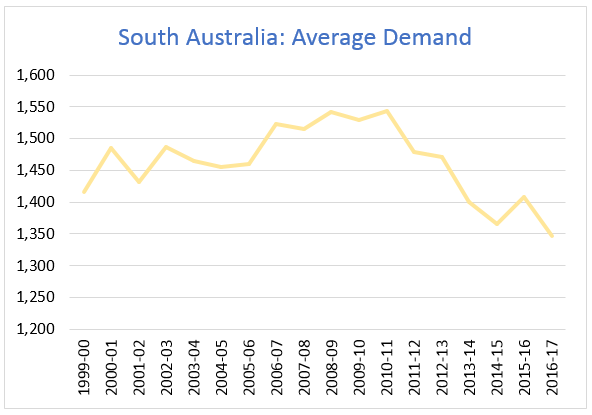
Source: NEM review and EGA Data
Figure 4: Average Demand in VIC
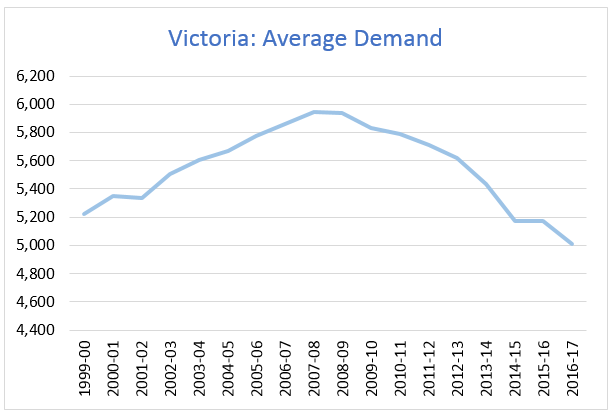
Source: NEM Review and EGA data
Contrary to the declining average demand in these states due to factors mentioned above, peak demand continues to show an upward trend. Peak demand occurs for all NEM regions during summer heatwaves, with the exception of Tasmania which experiences a winter peak due to heating use. As shown in Figure 5, peak demand is experiencing an upward trend in New South Wales, Victoria, Queensland and South Australia. This is due to a number of factors but increasing air conditioner use is a major contributor to the early evening summer peak, especially after prolonged heat waves.
Figure 5: Peak Demand 1998-2017
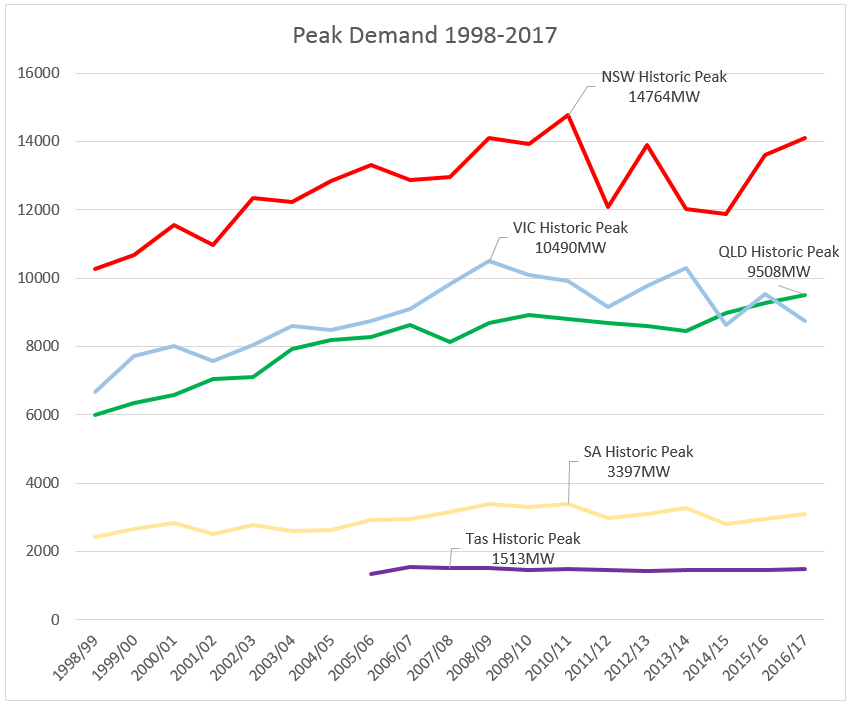
Source: AER, 2017
Figure 6 illustrates the changing nature of the peak to average demand ratio. When averaged across the NEM, the ratio of peak to average demand shows an increasing trend
Figure 6: Ratio of Peak to Average Demand in the NEM
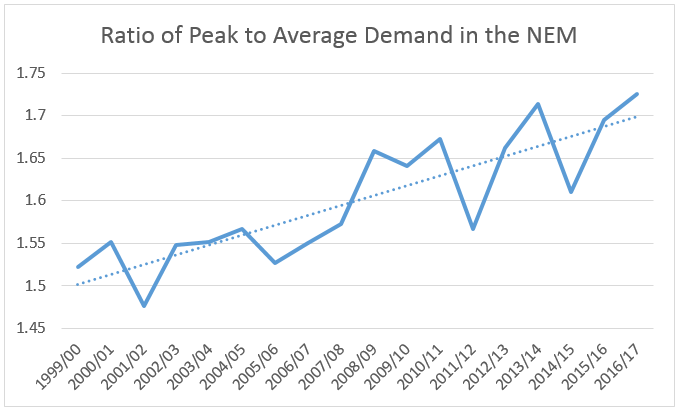
Source: NEM Review and EGA data
The divergence of peak and average demand in the NEM and especially Victoria, New South Wales and South Australia potentially has serious consequences. Regardless of whether average demand is decreased due to efficiency measures, if peak demand is not also declining, electricity generation and supply infrastructure must be kept in waiting to serve this peak load. This means in the scenario seen in Victoria, New South Wales and South Australia that the average utilisation (productivity) of the system falls. It has been claimed that if we could shave around 20 per cent off our electricity usage through efficiency measures, then everyone can “all stop worrying about building new plants of any description.”[iv] The problem as demonstrated by the continued divergence of average and peak demand is that while energy efficiency measures and increased use of behind the meter products such as solar PV bring benefits to customers by bringing down average demand, if peak demand continues to increase, problems of reliability continue to plague the system and the size of the required generation, transmission and distribution infrastructure remain the same.
Another factor which cannot be ignored when discussing water and electricity also stems from the physical differences between electricity and water. While water is a tangible resource with which we physically interact with every day, the same cannot be said for electricity. For many, it is difficult to determine what may drive our electricity use. The limited supply of water following prolonged drought can be easily interpreted by communities who have witnessed a lack of rainfall and can connect this with a need to conserve a precious resource. When it comes to electricity however, it is not a tangible resource and its generation, transmission and distribution occur mainly unnoticed by many.
While a comparison of the current electricity crisis with the early 2000s is understandable, there are clear differences between water and electricity and how demand interacts with supply. While calls for greater demand management are important when discussing electricity supply, especially if they can be focused on decreasing peak demand rather than average demand, the correlation of water demand management and electricity must be made with caution.
[i] http://www.abc.net.au/radio/programs/worldtoday/i-don%E2%80%99t-see-it-as-a-crisis-says-head-of-new-energy-body/8945170
[ii] http://www.theaustralian.com.au/business/mining-energy/energy-regulators-look-to-water-crisis-for-lessons/news-story/345f2b156dd0b0982dfc57ce46d22d4c
[iii] Sandiford, M., Forcey, T., Pears, A. and McConnell, D., 2015. Five years of declining annual consumption of grid-supplied electricity in Eastern Australia: Causes and consequences. The Electricity Journal, 28(7), pp.96-117.
[iv] http://www.abc.net.au/radio/programs/worldtoday/i-don%E2%80%99t-see-it-as-a-crisis-says-head-of-new-energy-body/8945170
Related Analysis
2025 Election: A tale of two campaigns
The election has been called and the campaigning has started in earnest. With both major parties proposing a markedly different path to deliver the energy transition and to reach net zero, we take a look at what sits beneath the big headlines and analyse how the current Labor Government is tracking towards its targets, and how a potential future Coalition Government might deliver on their commitments.
Transmission Access Reform: Has the time passed?
Last week submissions to the AEMC’s Transmission Access Reform consultation paper closed. It is the latest in a long running consideration of how best to ensure both efficient dispatch and investment in new generation to ensure new kit is sited in the best locations. But this continued pursuit of reform brings to the fore the question of whether other policy initiatives have already superseded the need for the proposed changes. We take a look at where the reform proposals have come from, as well as concerns about the suggested approach that have emerged.
EPBC Act: Does the Government have its finger on a climate trigger?
The Government’s Nature Positive Plan Reform has reignited the debate on whether Australia should add a climate trigger into our environmental protection laws. This was sparked after the Government announced stage three of the Nature Positive Plan would be focusing on “climate-related reforms, including the interaction between environment and climate laws.” So, what is a climate trigger and why is it such a contentious issue? We take a closer look.
Send an email with your question or comment, and include your name and a short message and we'll get back to you shortly.