

by Carl Kitchen
The changing mix: BP looks to the future
Having reviewed the energy trends last year in its global review, BP has also released detailed projections for energy out to 2040. As part of this outlook it also offers projections of the future electricity generation mix by fuel and region.
Under its evolving transition (ET) scenario[i] BP anticipates that the world’s gross domestic product (GDP) will more than double by 2040, driven by the increasing prosperity of fast-growing emerging economies. As a result, these economies are expected to experience the fastest growth in overall energy consumption, with China and India accounting for half of the total growth in global energy demand.
As a result of the jump in GDP, energy demand increases by around a third over the next 25 years and almost 70 per cent of this increase in primary energy demand is driven by electricity generation.
Power Demand
According to BP, power demand grows three times more quickly than other energy demand. Unsurprisingly, renewables are the fastest growing forms of generation and are expected to account for 40 per cent of the increase in primary energy demand.
BP’s outlook notes that with improvements in efficiency in the final use of electricity, there will also be a weakening in the link between economic growth and electricity consumption out to 2040. This is most noticeable in Organisation for Economic Cooperation and Development (OECD) countries.
Generation Fuel Mix
The generation fuel mix is set to shift materially, according to BP’s projections, with renewable energy continuing to gain in importance. Under its ET scenario renewables account for around half of the increase in power with their share of total generation increasing from 7 per cent today to around a quarter over the next 22 years (see figure 1).
Figure 1: Increased Global Electrification with Renewables Playing Increasing Role
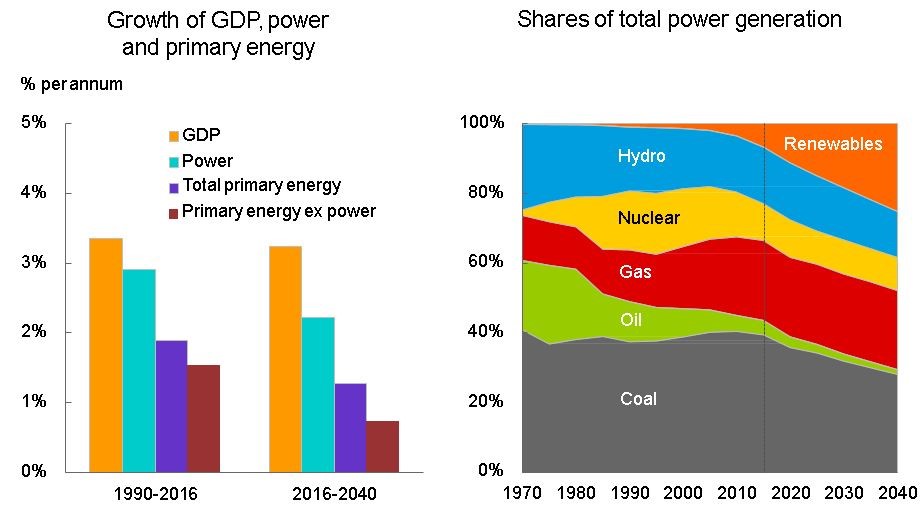
Source: BP Energy Outlook, 2018
The growth in renewable energy is supported by the increasing competitiveness of wind and solar. BP expects renewable subsidies to be gradually phased out by the mid-2020s as renewables are increasingly able to compete against other sources of energy. They will be aided by a gradual rise in carbon prices and continued regulation to encourage the shift to lower carbon emissions generation.
As noted in its energy review[ii] solar development has also benefited from the continuing fall in solar costs with auction bids of less than 5 cents/kWh now almost commonplace. The outlook notes that solar power in 2015 is expected to be more than 150 per cent higher than in the base case of the 2015 Energy Outlook, which reflects solar costs falling faster than anticipated. Solar energy is now projected to be widely competitive by the mid-2020s - a decade earlier than had previously been forecast. This more rapid decline in solar costs is partly due to faster technological gains, but also reflects stronger policy support, which helps push solar energy quickly down its “learning curve” (see figure 2).
According to the ET scenario, solar costs continue to follow the curve with module costs falling by around 24 per cent with every doubling of cumulative capacity. The rate of the decline in the per megawatt cost of utility scale solar, however, is expected to slow during the outlook period, simply because in part it takes longer to double the cumulative capacity.
Figure 2: Increase in Outlook for Renewables
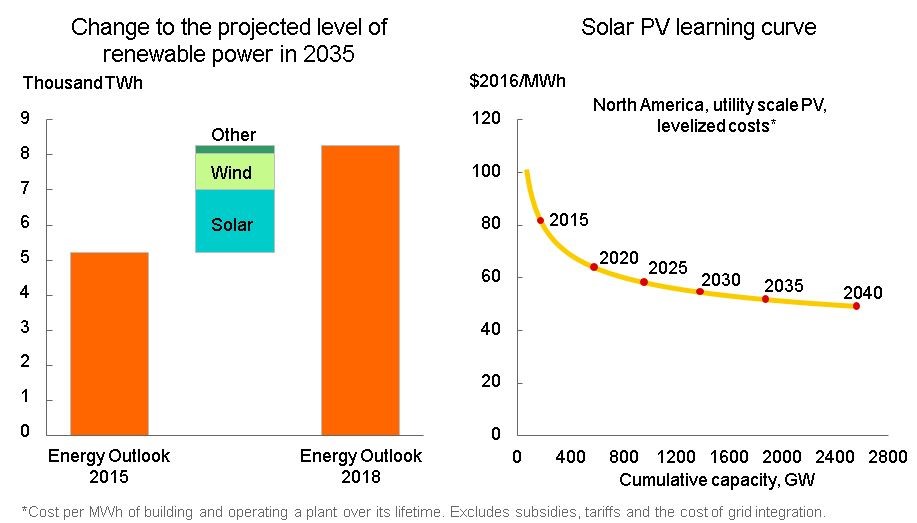
Source: BP Energy Outlook 2018
The overall increase in renewable generation is most strongly driven by China and the OECD. By 2040 the share of non-fossil fuels in the OECD and Chinese power sectors is projected to be broadly similar.
Broad Based Expansion
Renewables expansion is broad-based but China and other parts of the developing world take over from the European Union (EU) as the main source of growth. China continues to be the biggest single source of development – adding more renewable generation than all of the OECD nations combined – while India is expected to emerge as the second largest source of growth for renewables by 2030.
Renewable energy grows rapidly in India over the outlook period with particularly strong growth in solar energy.
By 2040 BP expects the share of non-fossil fuels in the OECD and Chinese energy sectors to be broadly similar, while the ratio of coal to gas remains much higher in the Chinese generation mix.
Figure 3: Increasing Share of Renewables Led by China and India
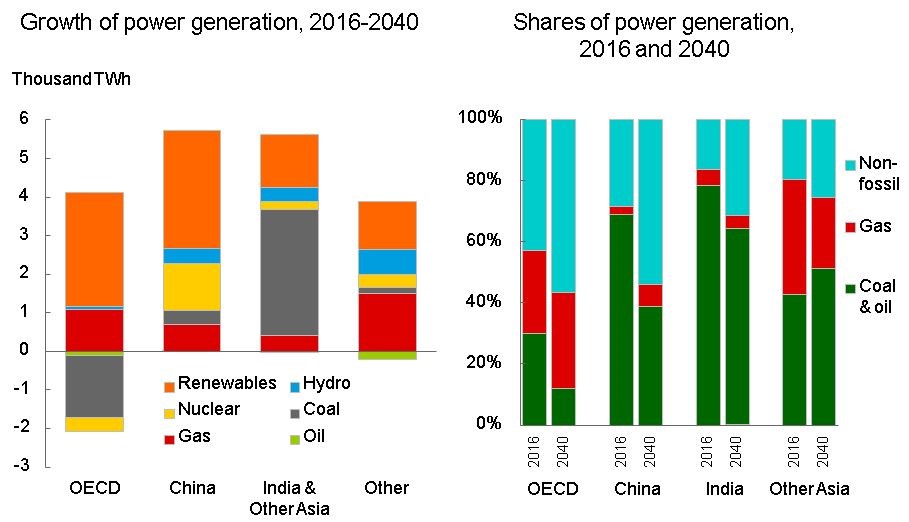
Source: BP Energy Outlook, 2018
The pace of renewables growth over the outlook period is faster than any energy source over a similar period. The closest equivalent is the rapid expansion in nuclear power in the 1970s and 1980s, which is shown in figure 4.
Figure 4: Renewables Growth
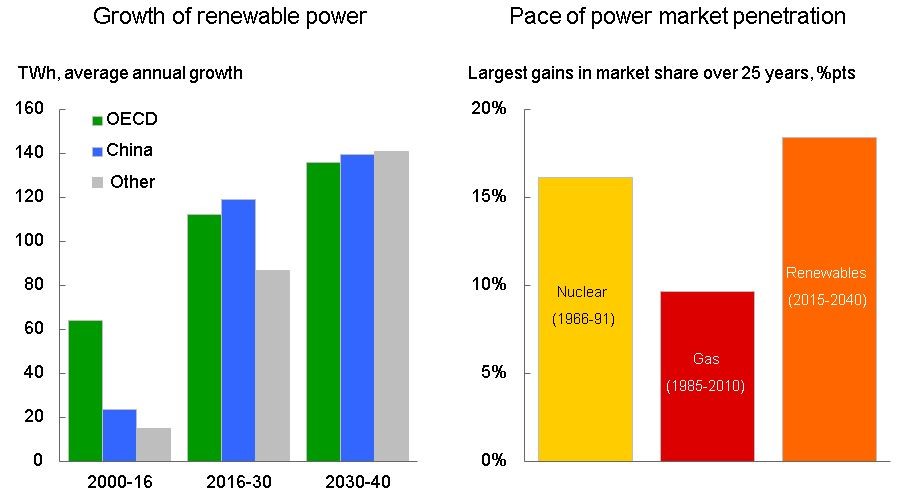
Source: BP Energy Outlook, 2018
The main loser in BP’s scenario is coal, which accounts for 13 per cent of the increase in power over the period, compared with more than 40 per cent over the previous 25 years. Despite this, coal remains the largest source of energy for generation in 2040 with almost a 30 per cent share.
Coal-fired generation is projected to fall in the OECD and starts to decline in China from around 2030. In contrast coal accounts for 45 per cent of India’s increase in energy demand and more than 70 per cent of that increase in coal consumption is for electricity generation, as India seeks to provide access to electricity to its entire population.
Coal remains dominant in generating electricity in the rest of Asia, accounting for the vast majority of the increase in power generation in the region. In line with that projection the pace of change in the structure of generation in the rest of Asia is less pronounced than in China. By 2040, India’s power sector is expected to be similar to China’s mix today.
The share of gas in the generation mix is projected to stay at just over 20 per cent during the period to 2040 after rising gradually over much of the past 25 years.
Nuclear and hydro power output continues to grow over the outlook period, although their shares in the overall generation mix decline as their growth does not match the growth in generation capacity.
Nuclear generation increases 1.8 per cent annually (or 59TWh) with China the main source of demand for nuclear power plants (51 TWh annually). China’s appetite for nuclear plants represents nearly 90 per cent of total global growth and as a result nuclear generation will increase its share of Chinese energy demand from 2 per cent today to 8 per cent in 2040. The drag on nuclear’s growth are declines in both the EU (-11 TWh) and the US (-10 TWh) as older plants are retired and not replaced.
The 1.3 per cent annual increase in hydro generation (61 TWh pa) is more broadly based across developing economies. Again China leads the way with a projected increase of 16 TWh a year. Annual growth in South and Central America (13 TWh) and Africa (11 TWh) are expected to be the next biggest regions for hydro expansion.
[i] The Evolving Transition Scenario assumes that government policies, technology and social preferences continue to evolve in a manner and speed seen over the recent past.
[ii] BP Statistical Review of World Energy 2018, page 6.
Related Analysis
Great British Energy – The UK’s new state-owned energy company
Last week’s UK election saw the Labour Party return to government after 14 years in opposition. Their emphatic win – the largest majority in a quarter of a century - delivered a mandate to implement their party manifesto, including a promise to set up Great British Energy (GB Energy), a publicly-owned and independently-run energy company which aims to deliver cheaper energy bills and cleaner power. So what is GB Energy and how will it work? We take a closer look.
Delivering on the ISP – risks and opportunities for future iterations
AEMO’s Integrated System Plan (ISP) maps an optimal development path (ODP) for generation, storage and network investments to hit the country’s net zero by 2050 target. It is predicated on a range of Federal and state government policy settings and reforms and on a range of scenarios succeeding. As with all modelling exercises, the ISP is based on a range of inputs and assumptions, all of which can, and do, change. AEMO itself has highlighted several risks. We take a look.
International Electricity Summit 2023: Australia goes to Washington D.C.
The International Electricity Summit is held every 12 – 18 months and brings together electricity industry leaders from around the globe to examine the major issues and headwinds facing the sector. It is an invaluable opportunity to meet colleagues from other developed economies and talk together to understand the challenges occurring in electricity markets globally.
Send an email with your question or comment, and include your name and a short message and we'll get back to you shortly.