

by Carl Kitchen
Taking stock of our energy resources
The most recent stocktake of Australia’s energy resources – the Australian Energy Resource Assessment (AERA) – has been released and offers insight into the extent and diversity of our energy resources. The AERA is produced by Geoscience Australia and the Economics Branch of the Department of the Environment and Energy, with support from the Australian Renewable Energy Agency. It is intended to be a scientific and economic assessment of Australia’s non-renewable and renewable energy resources.
In terms of electricity generation it highlights the growth and development of both gas and renewable generation. Here we take a close look at these generation sources and the AERA data.
Gas
The report highlights that Australia has substantial gas resources - conventional and unconventional (coal seam gas and shale gas). At current production rates it expects Australia to have enough conventional gas reserves for 34 years. Gas reserves are expected to increase substantially as new gas development projects convert current contingent resources into reserves to meet production projections.
The AERA comments that there is potential for additional unconventional gas resources, including coal seam gas (CSG) shale gas and tight gas.
It expects CSG to remain the most important part of the unconventional gas industry in the near term.
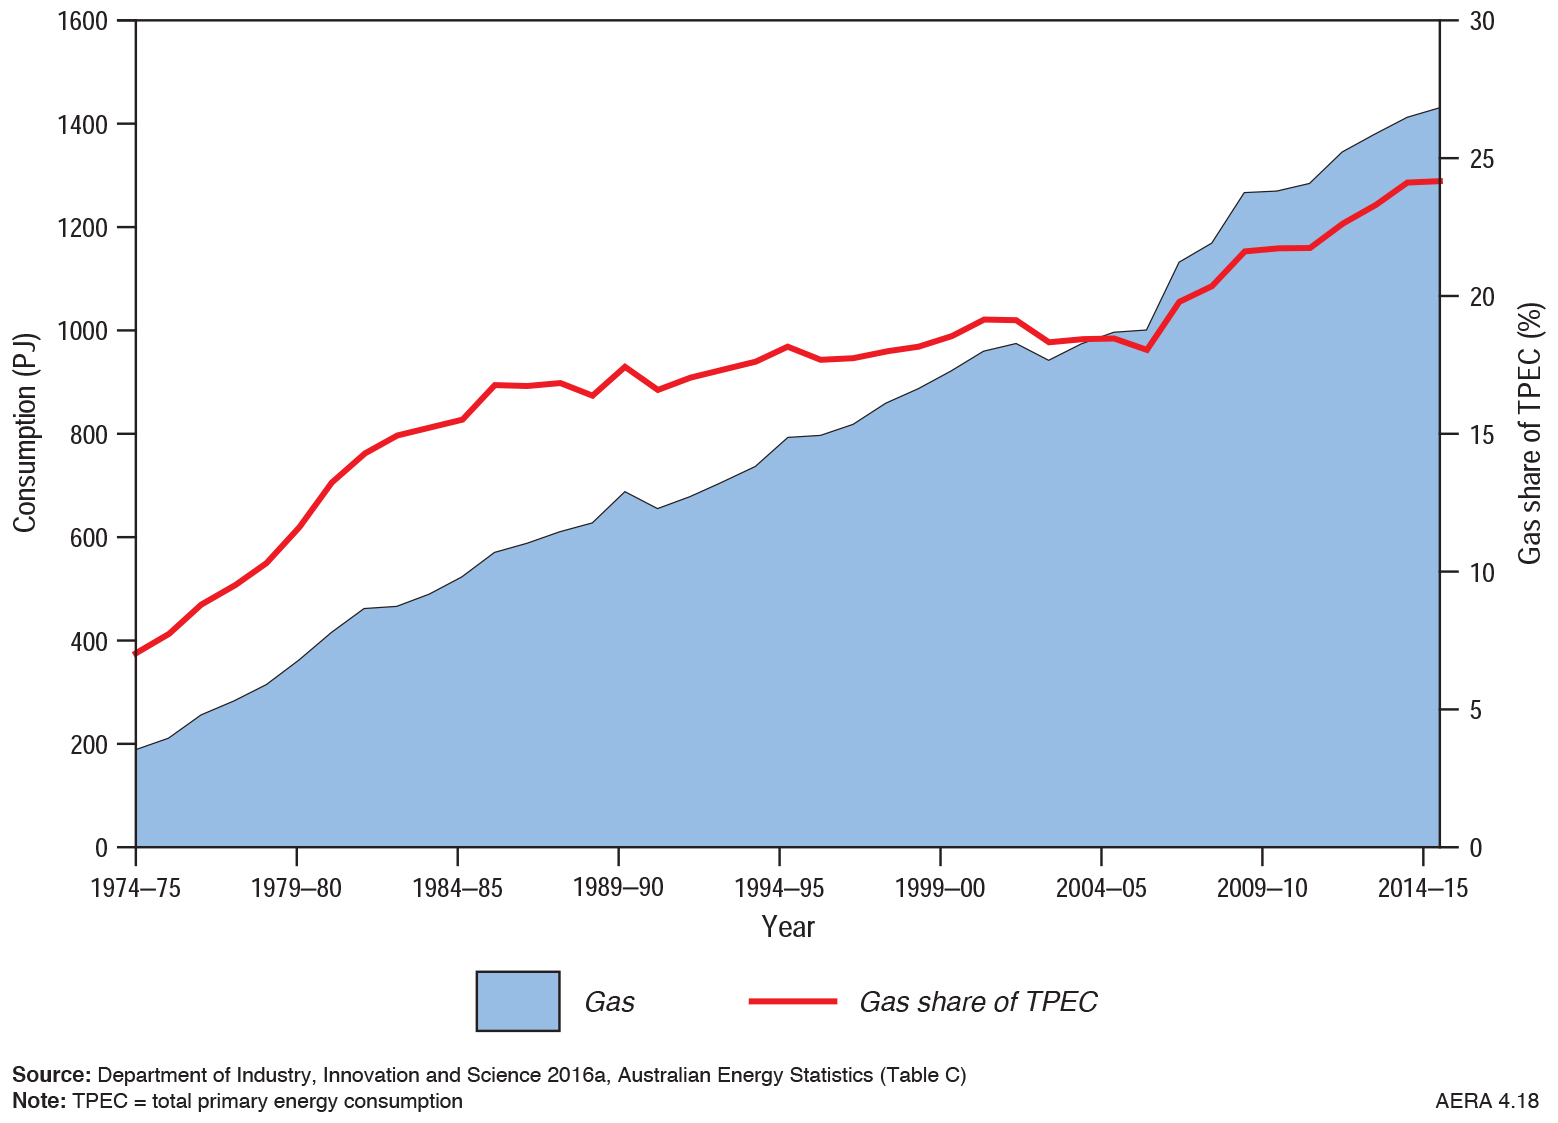
Domestic consumption of gas has grown steadily during the decade to 2014-15 (see figure 1).
Figure 1: Australian Gas Consumption and Share of Total Primary Energy Consumption
Gas-fired generation and manufacturing are the major consumers of gas (figure 2) accounting for around 70 per cent of consumption, with consumption for electricity generation showing a rapid increase since 2004-2005, increasing at an average of 7.9 per cent each year to 563PJ in 2014-15 (figure 3).
Figure 2: Australian Gas Consumption by Sector
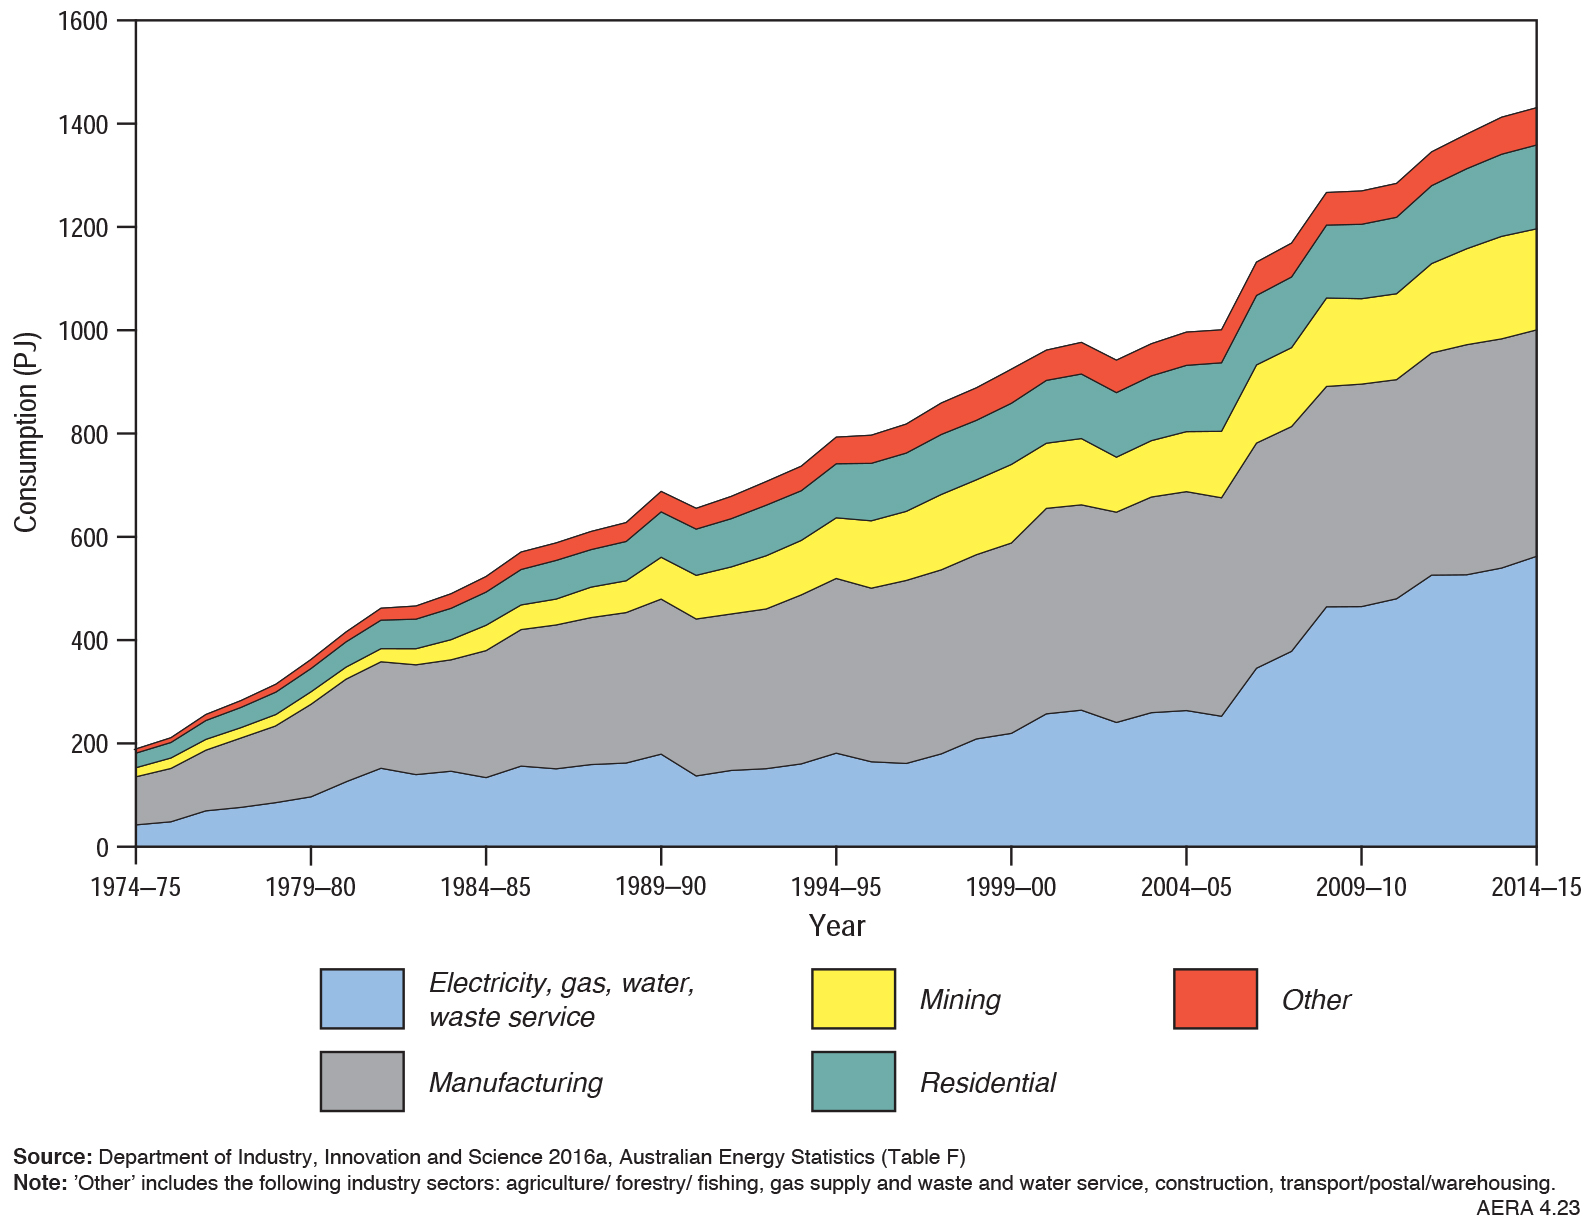
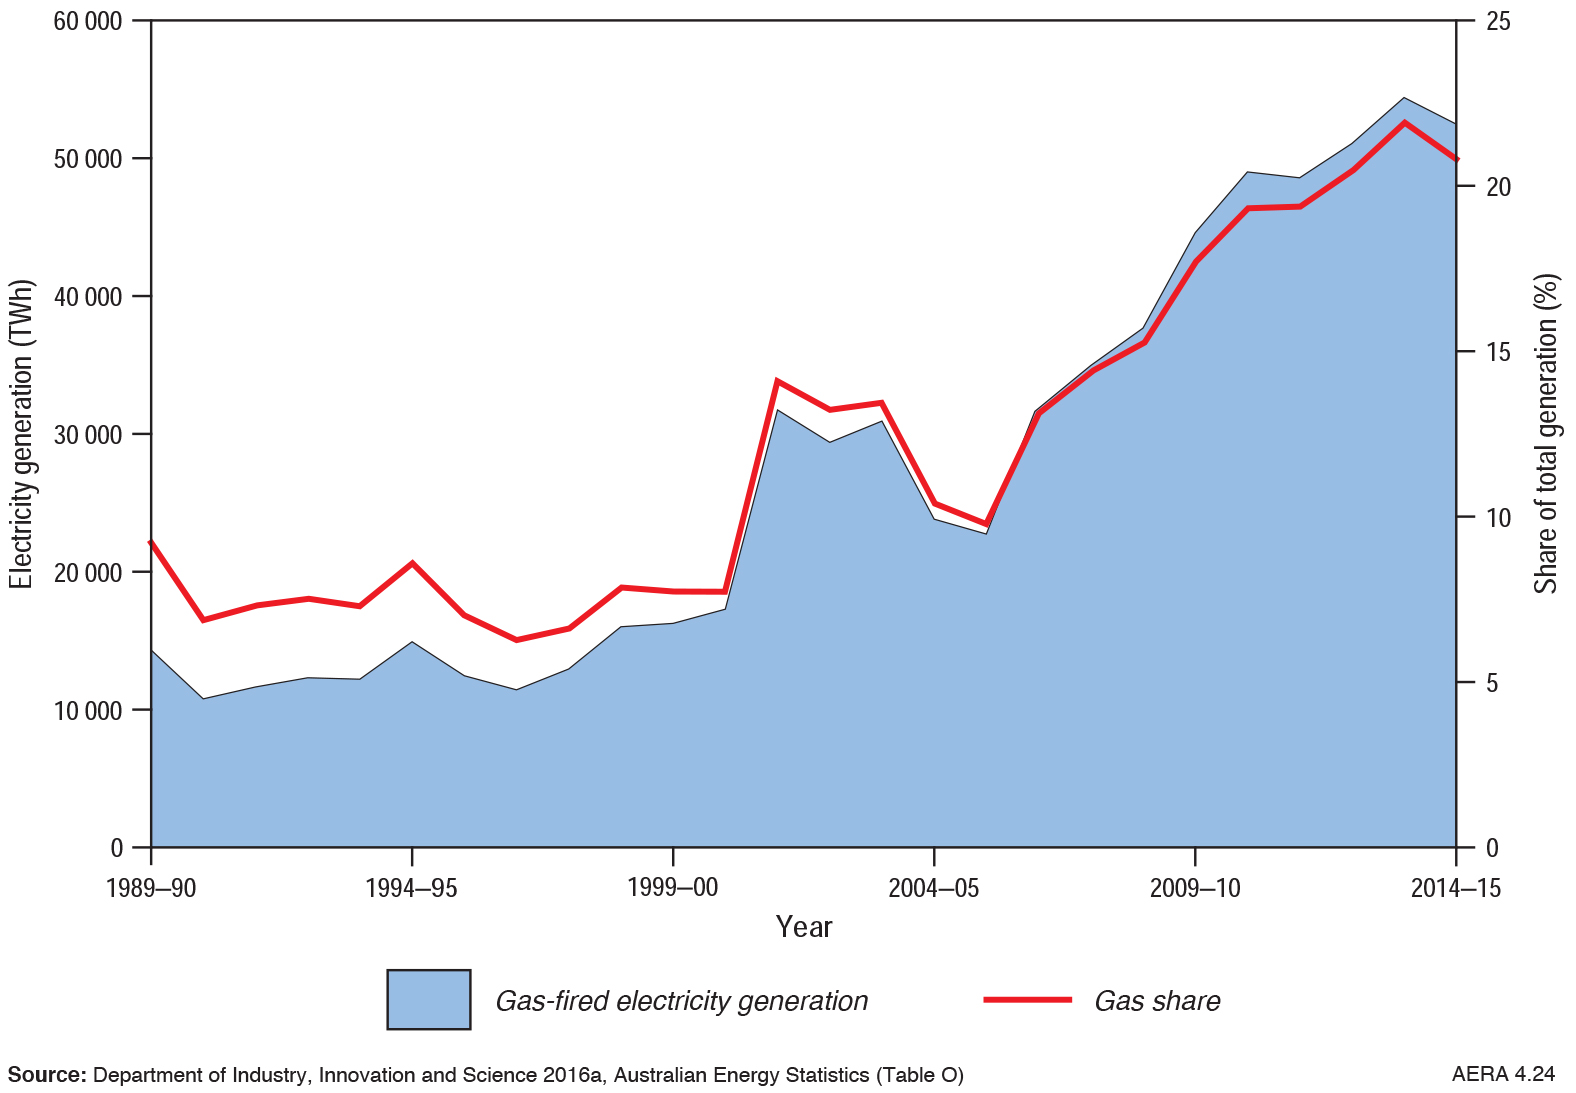
Figure 3: Gas-fired Generation and Electricity Generation Mix
The key contributor to the growth of natural gas consumption in Australia during the decade has been the strong growth in gas-fired electricity generation in Queensland and Western Australia. Gas consumption by Queensland’s electricity generators grew from 22PJ in 2004-05 to 167PJ in 2014-15. Gas consumption in WA’s electricity generation grew from just over 104PJ in 2004-05 to 246PJ 2014-15 (an average annual growth of 9.1 per cent).
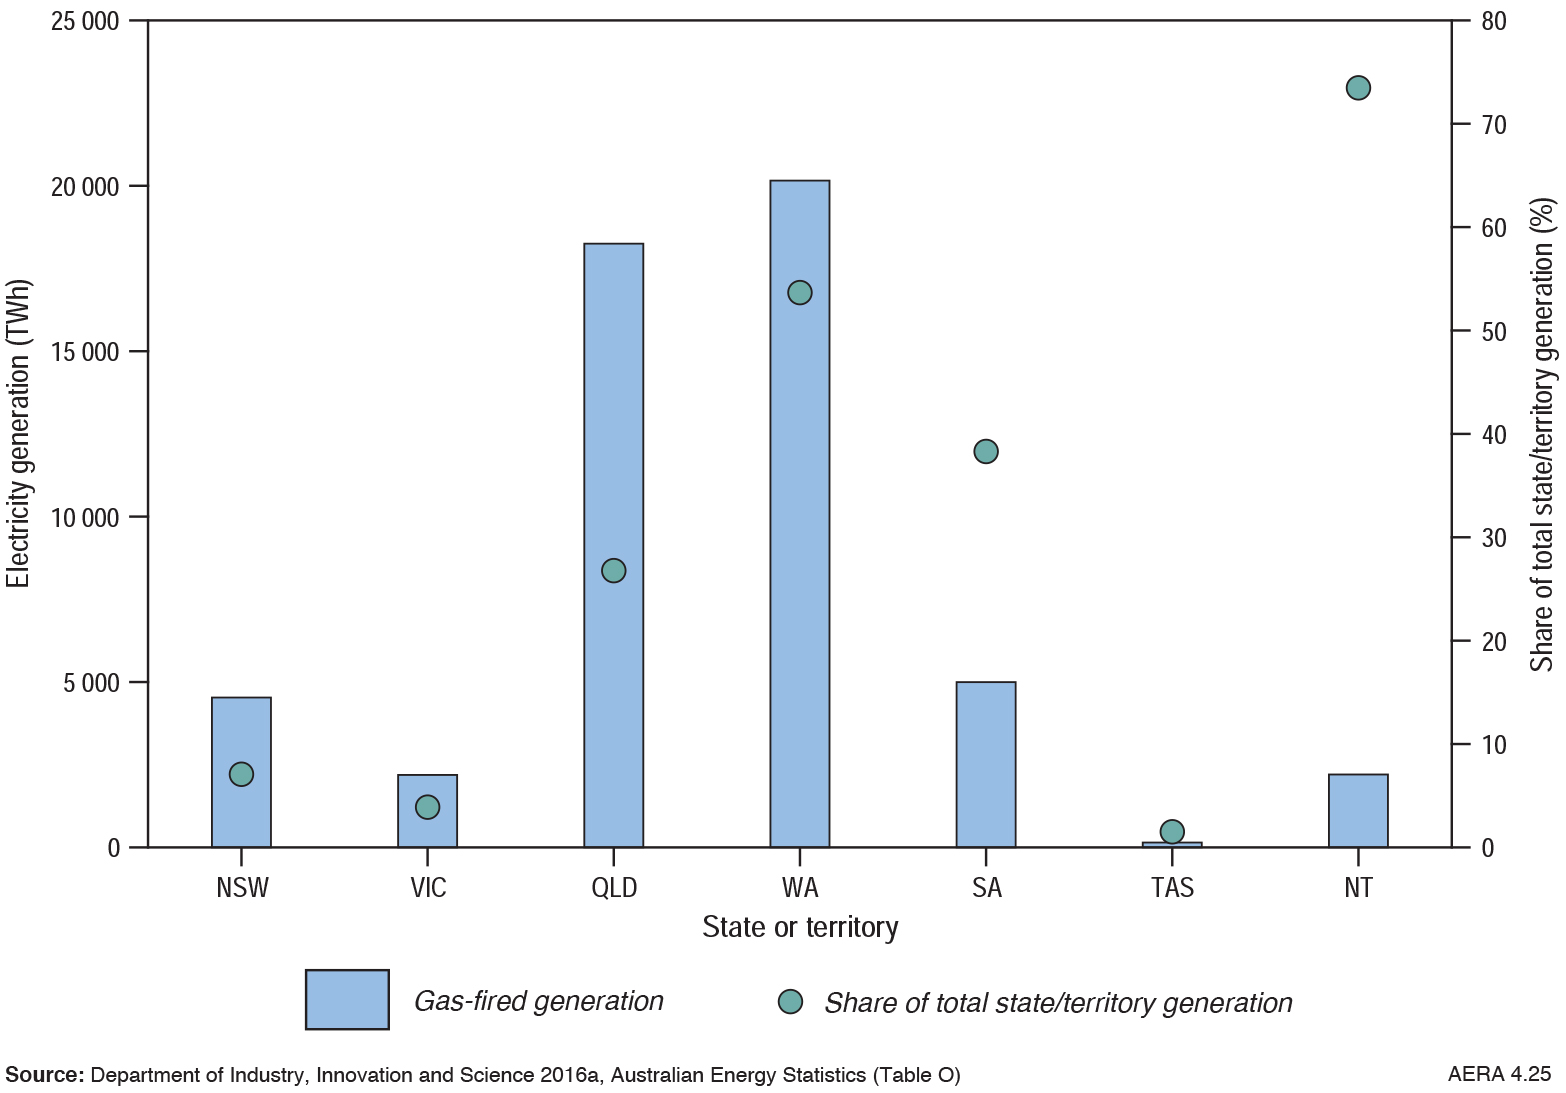
Figure 4 below shows the gas-fired generation by state and territory and its share of total generation in each jurisdiction.
Figure 4: Gas-fired Generation and Share of Total Generation
Electricity generation from gas increased substantially during the decade with gas generation growing annually at an average of 8 per cent and reaching 52.5TWh in 2014-15. It also notes that gas generation fell by 3.6 per cent from 2013-14 to 2014-15, and largely attributes this to higher domestic gas prices. The assessment notes that the combined effect of higher gas prices, greater energy efficiency, concerns about the adequacy of gas supplies and increasing competition from renewables in electricity generation are expected to moderate demand growth in the industrial sector and reduce gas-fired electricity generation in eastern Australia.
Gas is seen as a transition fuel to a low emissions future, the AERO notes that, but whether this eventuates will depend in the longer term on a range of factors, including policies to reduce emissions, the trend to higher end-use energy efficiencies and the cost of new technologies that compete with gas such as use of reverse-cycle air-conditioning in homes, which is competitive with gas heating, and solar hot water is a viable alternative to gas-fired units.
It notes that in generation, solar PV and wind are on a downward cost trajectory. On the flip side, and in favour of gas generation, is the fact that it is dispatchable and can stabilise the electricity system, while gas peaking plants offer a flexible backup to intermittent renewable generation.
Renewable generation
The AERA projects that the development of renewables will continue to develop significantly up to 2020 driven by government policy, specifically the federal Renewable Energy Target, as well as the reduction in the cost of technologies.
“Advances in renewable energy generation and storage technologies and better mapping of resource potential will be important for continued uptake, and so will technologies and policies for grid integration,” the AERA says.
AERA reinforces the fact that Australia has plentiful and widely distributed wind, solar, geothermal, wave and tidal resources (see figure 5).
Figure 5: Distribution of Renewable Energy Resources, excluding bio and hydro resources
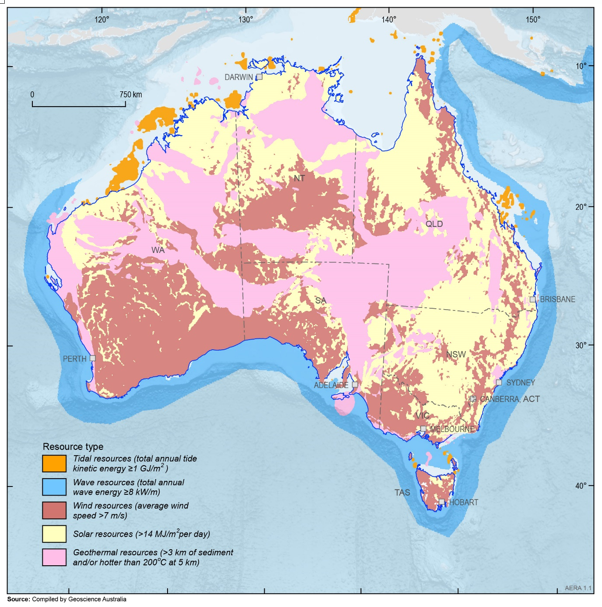
It notes that hydro energy resources have been extensively developed, and wind, solar and bioenergy resources are increasingly being exploited for electricity generation. Although adoption of offset technologies (such as geothermal heat pumps, solar hot water) has gradually increased, the other renewable energy resources remain largely untapped for electricity generation.
“The utilisation of renewable energy will continue to increase significantly to around 2020, reflecting government policies (e.g. the Renewable Energy Target) and falling installation costs. Advances in renewable energy generation and storage technologies and better mapping of resource potential will be important for continued uptake, and so will technologies and policies for grid integration.”
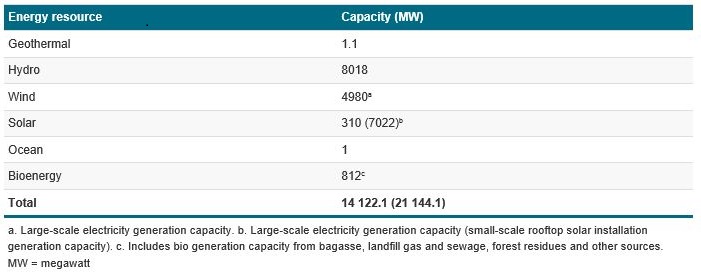
Table 1: Renewable Electricity Generation Capacity in Australia
Wind
The AERA notes that Australia has some of the “world’s best wind resources along its south-western, southern and south-eastern margins, as well as along areas of the Great Dividing Range in eastern Australia and throughout Tasmania.
Areas with average wind speeds of 9m/s or greater are regarded as areas with high wind resources. Lesser resources may also be economic to exploit if they are more accessible and closer to the grid.
It notes that good offshore wind resource sites are located off the coasts of South Australia, Victoria and Tasmania but with ocean water depths increasing rapidly around our coastline this resource could be relatively high cost to develop. The exception, it notes, are areas offshore from Gippsland in Victoria where water depths are less than 50 metres at distances of around 3km offshore.
A significant proportion of Australia’s wind development has been in South Australia and Victoria because of their high wind resource potential and favourable policies, with SA having one of the highest penetrations of wind energy generation in any energy-only market (see figures 6 and 7 below).
Figure 6: Wind Generation by State and Compound Annual Growth Rate (2008-09-2014-15)
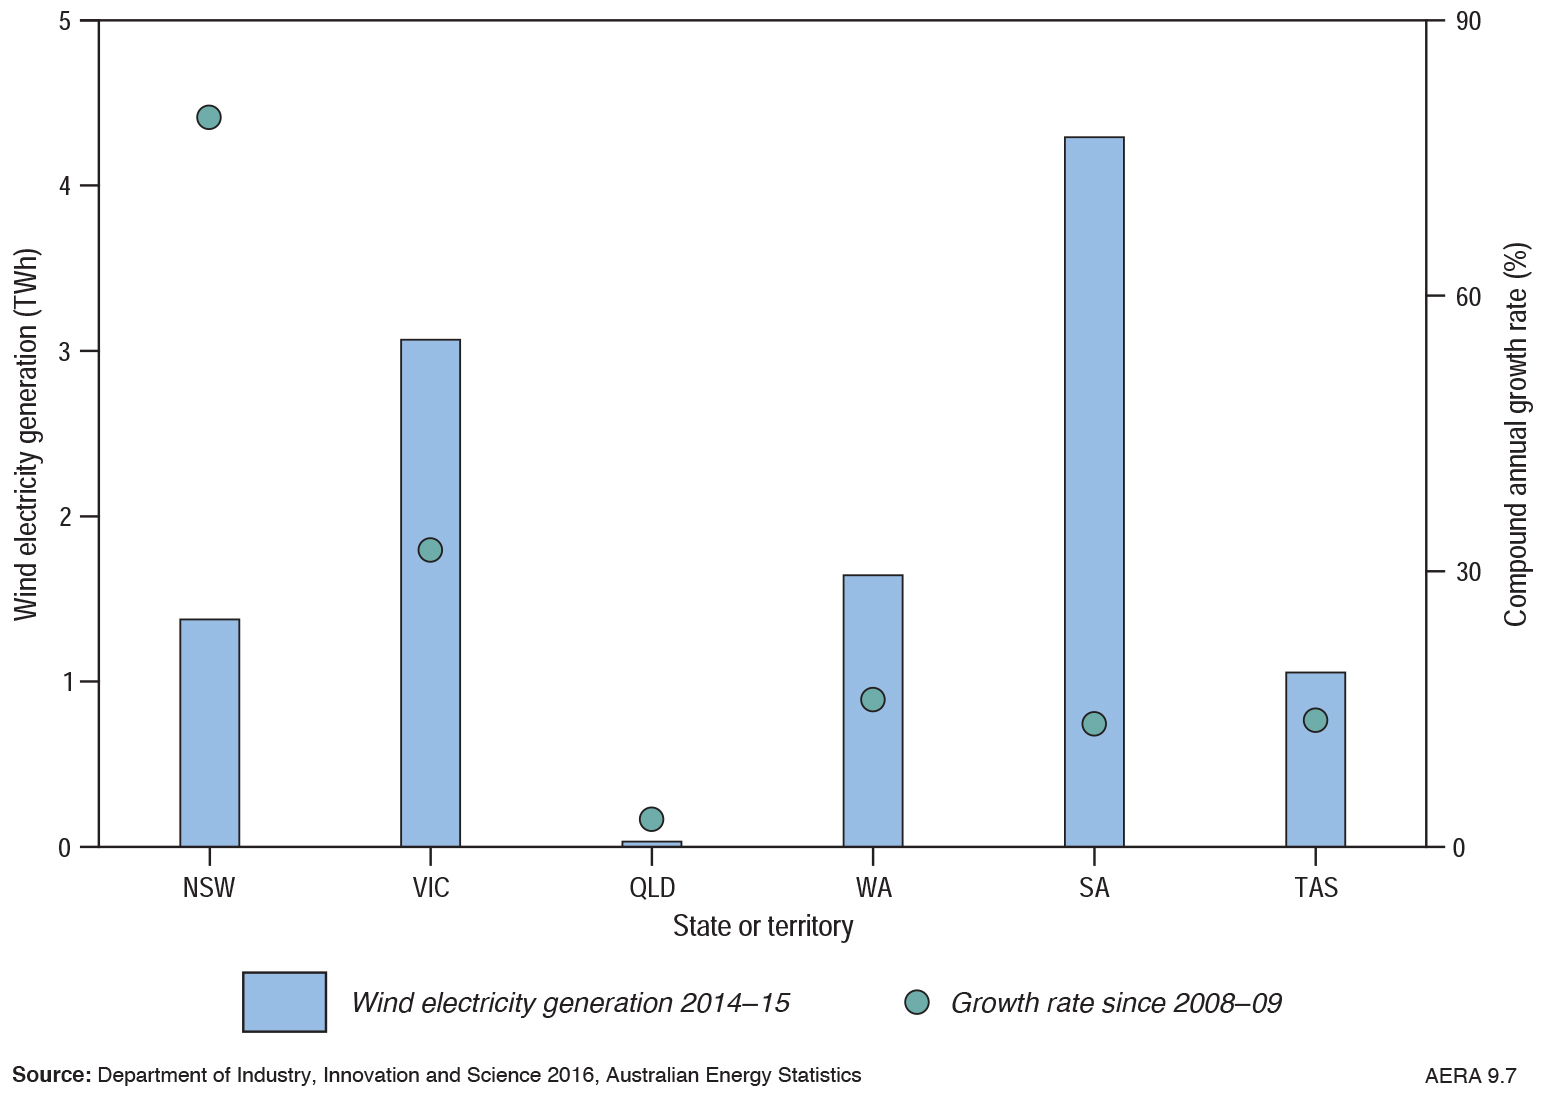
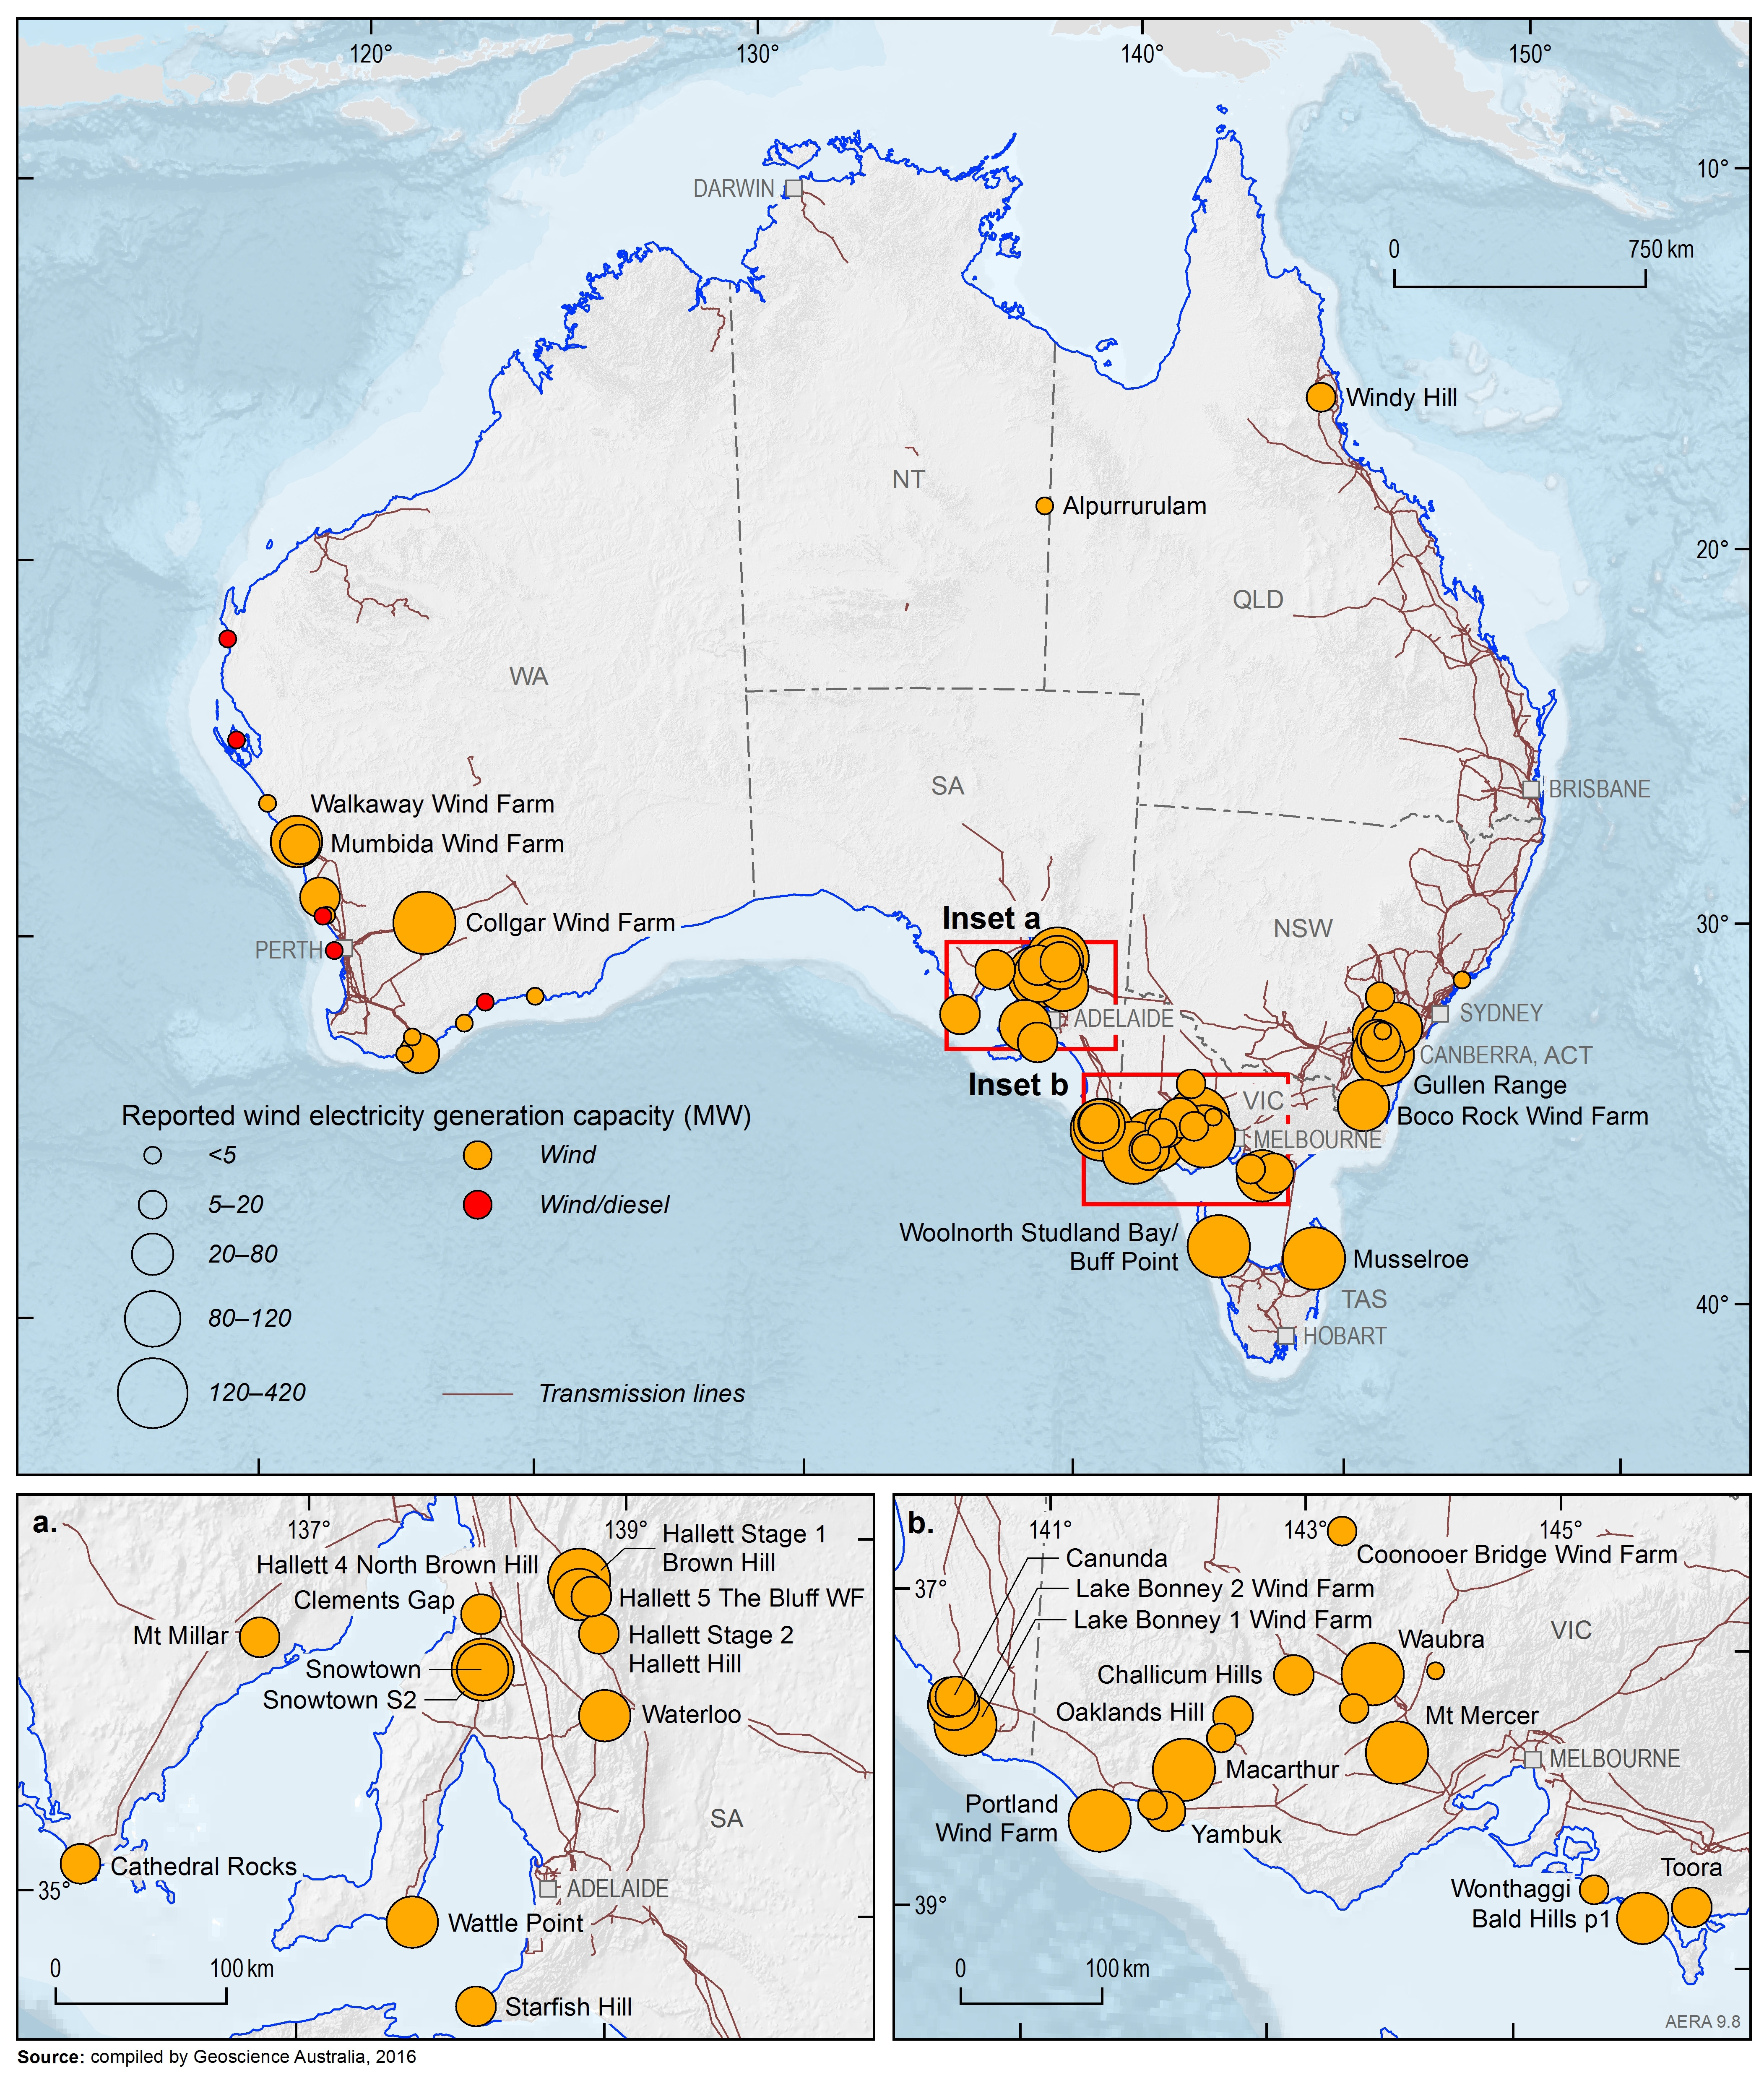
Figure 7: On-grid Wind Generators
Australia’s primary wind energy consumption rose by 12 per cent from 2013-14 to 2014-15 to 41.3PJs. This was driven by support from state and territory-based renewable energy schemes and the national Renewable Energy Target – wind generation accounted for 0.7 per cent of primary energy consumption in 2014-15. The AERA notes that the use of wind energy is on a smaller scale than in other OECD countries, but that Australia has recently experienced faster growth than OECD countries (from a lower base).
Table 2: Key Wind Energy Statistics
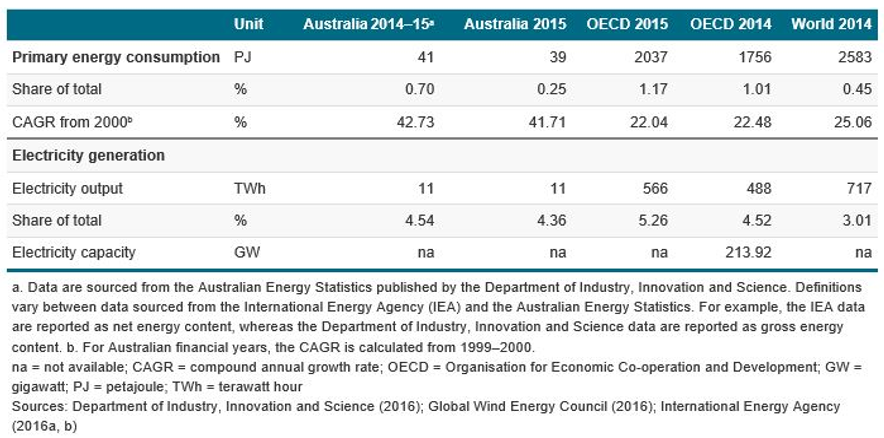
The AERA reports that last year 664MW of new large scale wind capacity was commissioned and five new wind farms - involving 196 turbines and 380MW of capacity nationally - came online. It forecasts that as the most productive sites in SA are built out, investment will swing to other states and expansion to offshore resources could be considered.
The report notes that wind is set to play an increasingly important role in Australia’s energy mix and as the penetration of wind generation grows, managing transmission congestion, the variable nature of the resource and ensuring smooth integration into the grid will be the key challenges to its continued development.
Solar
The AERA confirms that Australia has the highest per capita uptake of rooftop solar capacity globally. The country has the highest solar irradiation, on average, receiving an estimated 35 megajoules per square metre per day or 9.7kWh per square metre per day and an average of 58 million PJ of solar radiation each year.
“Theoretically, if only 0.1 per cent of the incoming energy could be converted into usable energy at an efficiency of 10 per cent, Australia’s energy needs could be supplied by solar energy,” it comments. It also argues that the energy falling on a 50km by 50km would be enough to meet all of Australia’s electricity needs[i].
Solar has been the fastest-growing technology in the renewable energy sector in Australia during the past decade. At the end of 2017, Australia had 2.8 million solar energy installations, with small-scale solar PV systems accounting for over 60 per cent of these. As at 31 December 2017, rooftop solar PV systems were installed in over 20 per cent of Australian households, and small-scale solar hot water heaters were installed in over 10 per cent of Australian households. In some locations, the percentage of households with rooftop solar PV systems is already over 40 per cent[ii] (see also our Solar Report).
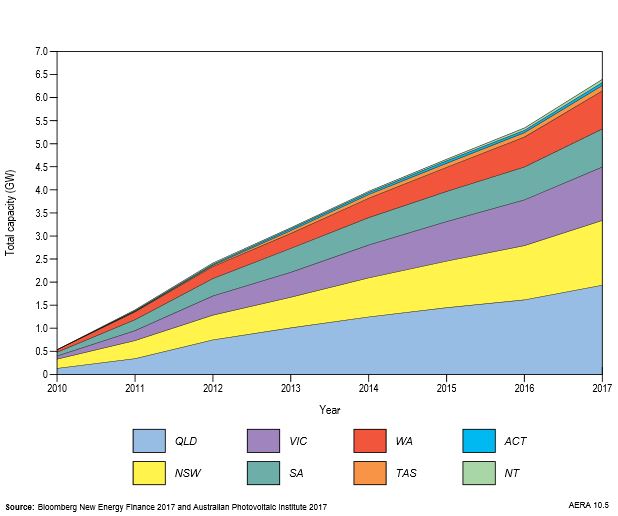
Figure 8 shows the growth in solar PV generation and share of electricity generation since 1999, while the share of small-scale solar PV capacity by state and territory is highlighted by figure 9.
Figure 8: Growth in Solar PV Generation and Share of Generation, 1999-2015
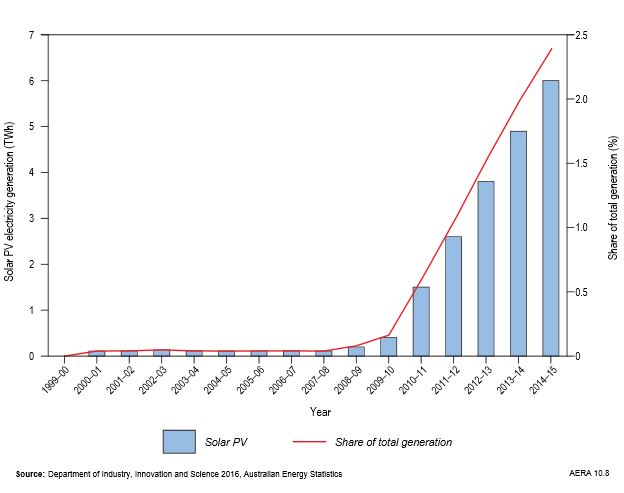
Figure 9: Total Small-scale Solar PV Capacity, by state and territory
The AERA’s outlook for solar states is that “further development of the solar resource in Australia will be influenced by specific policies to create incentives, as well as infrastructure investment, and research, development and deployment (RD&D). Future retail electricity prices will also be an important factor for rooftop photovoltaic installation, particularly by businesses.”
[i] Australian Renewable Energy Agency, Solar
[ii] Australian Photovoltaic Institute 2018
Related Analysis
The gas transition: What do gorillas have to do with it?
The gas transition poses an unavoidable challenge: what to do with the potential for billions of dollars of stranded assets. Current approaches, such as accelerated depreciation, are fixes that Professorial Fellow at Monash University and energy expert Ron Ben-David argues will risk triggering both political and financial crises. He has put forward a novel, market-based solution that he claims can transform the regulated asset base (RAB) into a manageable financial obligation. We take a look and examine the issue.
Australia’s Sustainable Finance Taxonomy: Solving problems or creating new ones?
Last Tuesday, the Australian Sustainable Finance Institute (ASFI) released the Australian Sustainable Finance Taxonomy – a voluntary framework that financiers and investors can use to ensure economic activity they are investing capital in is consistent with a 1.5°C trajectory. One of the trickier aspects of the Taxonomy was whether to classify gas-powered generation, a fossil fuel energy source, as a “transition” activity to support net-zero. The final Taxonomy opted against this. Here we take a look at how ASFI came to this decision, and the pragmatism of it.
Gas in the NEM: Is there a case for a new and expanded RERT?
Gas-powered generation (GPG) will be essential to maintaining reliability in the National Electricity Market (NEM) as coal exits and the grid becomes increasingly reliant on variable renewable energy (VRE) and storage. However, current market settings and investment mechanisms are failing to support the GPG capacity needed for both regular firming and emergency insurance against high-impact, low-probability (HILP) VRE droughts. We take a closer look at whether a new and expanded Reliability and Emergency Reserve Trader (RERT) framework could provide a viable pathway to deliver insurance GPG outside the market without distorting competitive outcomes.
Send an email with your question or comment, and include your name and a short message and we'll get back to you shortly.