

by Panos Priftakis
Reserve Plant Margins: How firm are they?
Energy systems are built to meet maximum demand, which means that there will always be, on average, some surplus generation. In the past two years the level of surplus generation in the National Electricity Market (NEM) has been declining, with recent heatwaves across the eastern states and the closures of a number of coal fired power stations increasing the focus on surplus generation and beginning to put stress on the market.
New South Wales, Queensland, Victoria and South Australia have all seen declines in their reserve plant margins over recent years. Although SA and Vic have average reserve plant margins of 25-35 per cent - sufficient to cater for unexpected weather or generating events - those figures fall significantly when intermittent generation is removed from the reserve plant margin. The margin then is below 15 per cent for both states. The Australian Energy Market Operator (AEMO) has assessed the market in SA and Vic and has advised there is sufficient generation to meet maximum demand, and has also assessed the recent supply adequacy across the NEM over the next 10 years.
Declining Reserve Plant Margin across NSW, Vic, SA and Qld
The reserve plant margin is a measurement intended to assure sufficient electricity capacity is in the market to meet normal peak demand levels. The reserve plant margin for the purpose of this analysis is calculated by adding the principal generation plant capacity and dividing it by the peak demand for the given year. The calculations exclude embedded generation, non-grid private generators and non-scheduled intermittent generators. The purpose of planning and operating the reserve is to balance the risks of outages and the overall costs of maintaining a redundant system. The recent heatwaves across the eastern states of Australia put pressure on the reserve plant margins in Queensland, NSW, and Victoria, as shown in Figure1 - 4 below.
The reserve plant margins also include market-scheduled intermittent technologies. Although there is technically sufficient capacity to meet peak demand across these states, intermittent technologies are dependent on the weather and are not always available. It is therefore worthwhile to consider the reserve plant margin without intermittent technologies for the past three years across the charts to assess the amount of dispatchable generation that would be available. For the 2016-17 year we have assumed completion of the closure of the Hazelwood power station (which is expected to close at the end of March), as well as numerous generation projects that are expected to be completed in 2017. Figure 2 shows Victoria’s reserve plant margin and includes an estimated level for 2017-18 based on AEMO’s 10 per cent scenario for maximum demand and the impact of the closure of Hazelwood.
Figure 1: SA Reserve Plant Margin
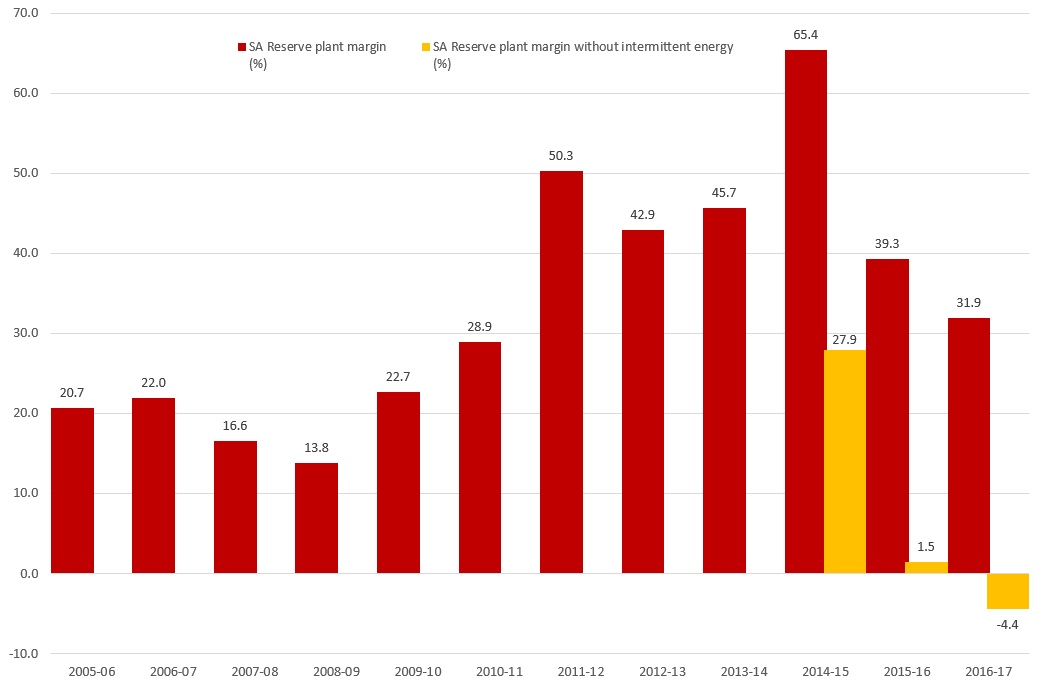
Source: NEM Review and AEC Analysis, 2006-17
Figure 2: Vic Reserve Plant Margin
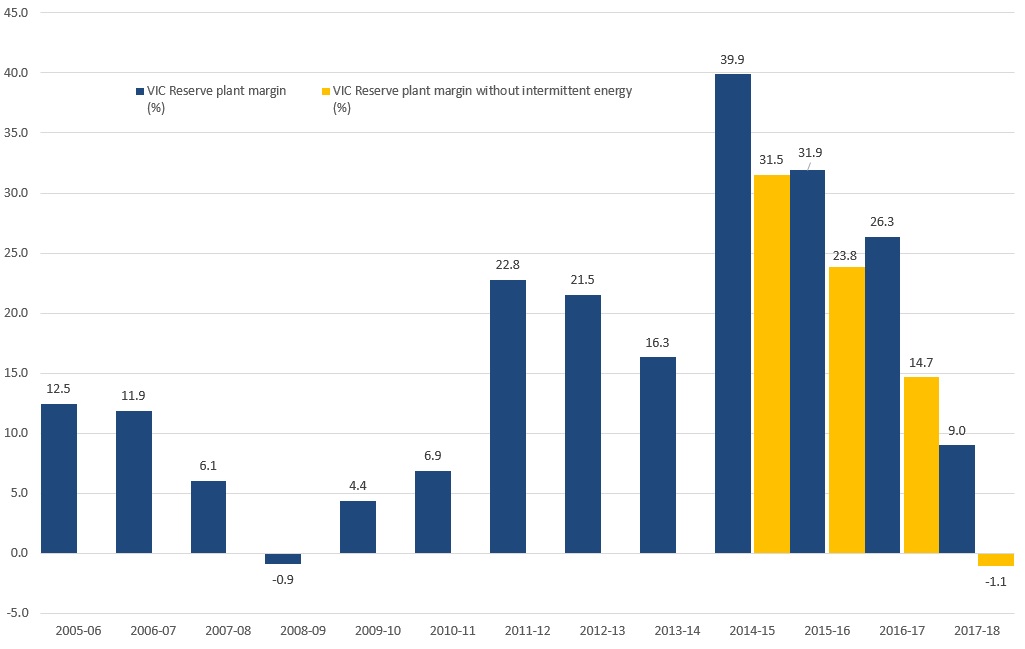
Source: NEM Review and AEC Analysis, 2006-17
Figure 3: NSW Reserve Plant Margin
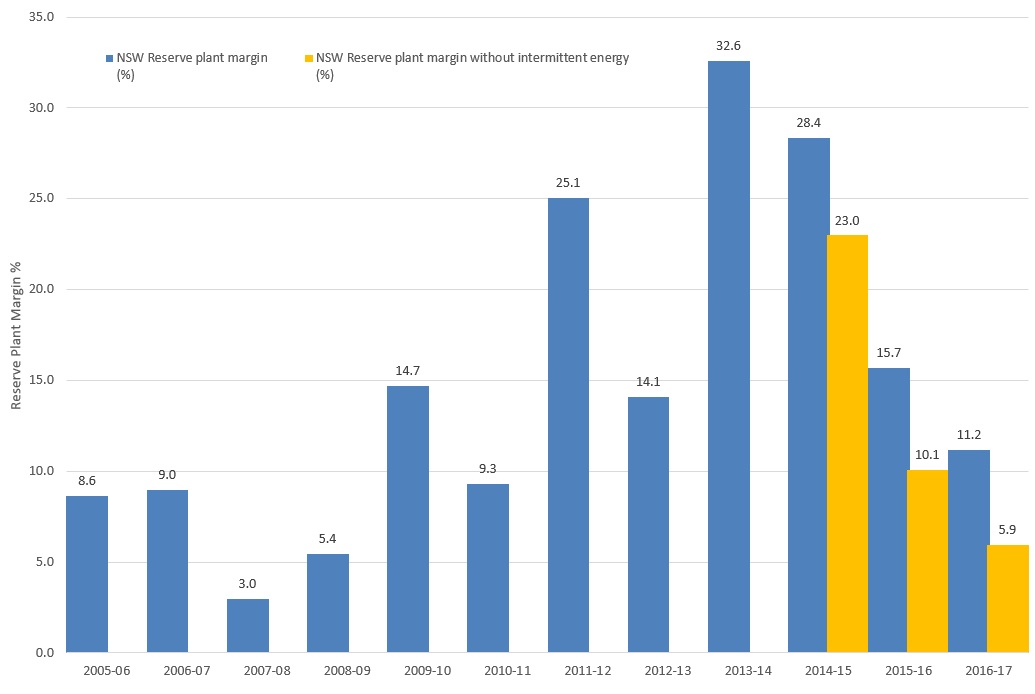
Source: NEM Review and AEC Analysis, 2006-17
Figure 4: QLD Reserve Plant Margin
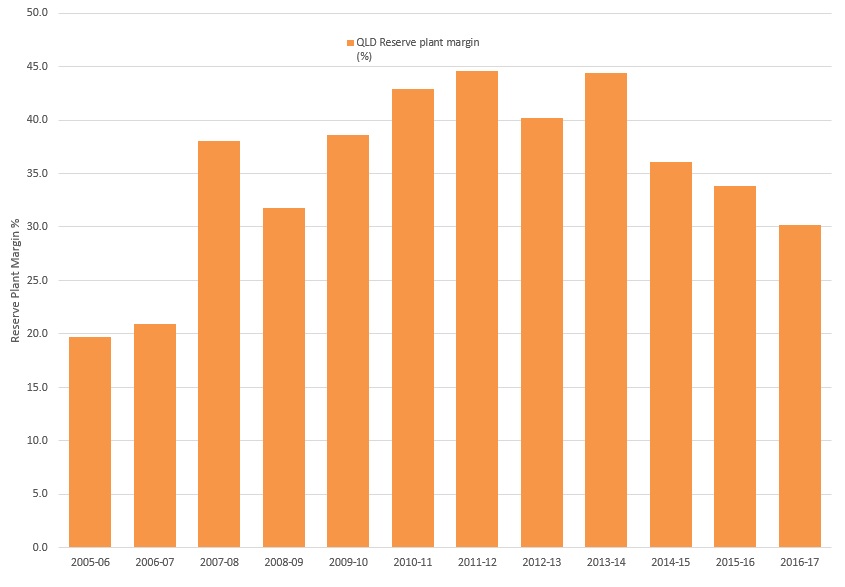
Source: NEM Review and AEC Analysis, 2006-17
The reserve plant margins including intermittent generation across SA, Victoria and Queensland are on average around 25-35 per cent. This is sufficient to cater for scheduled maintenance as well as forced outages of generating units in the power system. In contrast, New South Wales is in a more vulnerable position given it sits just above 10 per cent.
The removal of intermittent generation from the reserve plant margin in NSW, SA and Victoria, on a day the wind isn’t blowing and the sun isn’t shining, leads to the margin falling to below 15 per cent for each state. In Queensland’s case, although there is no immediate threat to the reserve plant margin, the decline in the margin across its neighbouring states is likely to have an impact over the next few years. Across the NEM, the removal of intermittent technology decreases the reserve margin by 9 per cent, as shown Figure .
Figure 5: NEM reserve plant margin
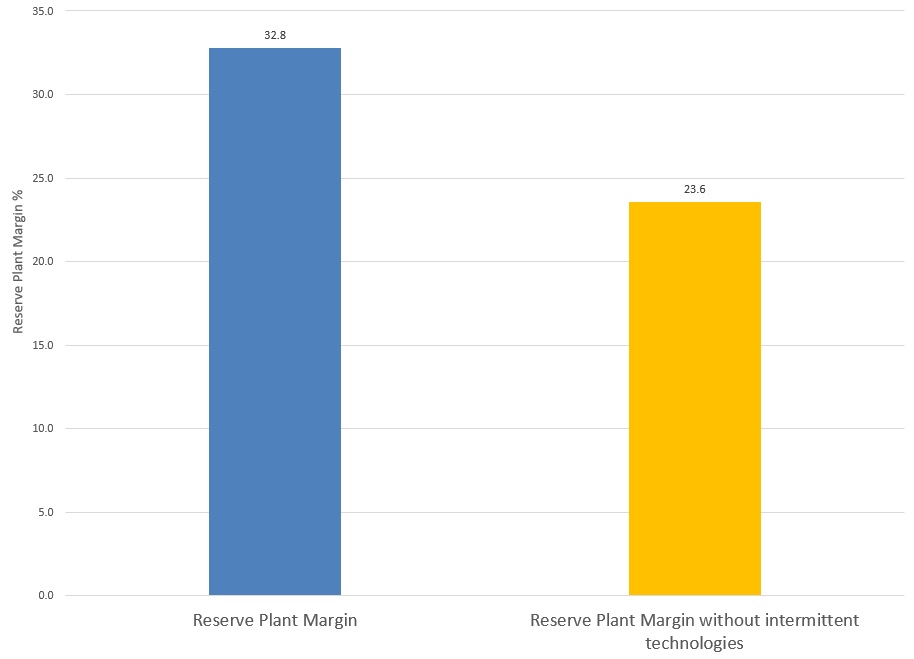
Source: NEM Review and AEC Analysis, 2016/17
AEMO has assessed the market in SA and Victoria and has advised that there is sufficient generation to meet maximum demand. The most recent Electricity Statement of Opportunities (ESOO)[i] assessed the supply adequacy across the NEM over the next 10 years. AEMO looked at the short-term market responses to avoid projected reliability standard breaches in SA and Victoria which could include:
- Increasing generation from existing generators in the NEM which would include NSW black coal-fired and SA gas-fired generation.
- Conservation of water storage this year for the use of hydro when supply is tight next summer.
- Returning certain withdrawn generation plant to service in the NEM.
- Demand-side participation (DSP), which can refer to a wide variety of short-term demand responses by customers to electricity price and/or reliability signals.
- Committing to already-proposed generation, network, or non-network projects in the NEM
- Permanent demand reduction in response to anticipated increases in market prices.[ii]
Why has the reserve margin declined?
The increased level of demand in both NSW and Queensland due to the extended heatwaves this summer have partly led to the reserve plant margin declining over the past year. In January, as a result of state-wide mean maximum temperatures well above the average, Queensland recorded a new all-time peak for electricity demand of 9,412 MW[iii]. This was on 18 January. To the south, heatwave conditions pushed NSW very close to its record peak demand. If subsequent years are not as warm we could obviously see the reserve margin improve.
In addition to increased demand, the decommissioning of power plants has reduced the reserve margin. During 2008-09 after several years of increasing demand for electricity as well as the introduction of the Renewable Energy Target (RET), a number of renewable projects were completed. The increased investment in wind and other renewable generation and a decline in demand from 2008-09 led to growth in the reserve plant margin over a five-year period.
Between 2008-09 and 2014-15 there was a trend of increasing levels of oversupply in generation. More recently that trend has shifted again. Increasing demand and the decommissioning of coal-fired generation capacity across the NEM have led to a reduction in the amount of NEM oversupply. This is despite the continued increase in renewable energy[iv]. Figures 6 and 7 show the decrease in baseload generation, and the age of remaining coal-fired plants in the market respectively. Some of the older plants will be coming to the end of their operational lives, which has the potential to put further pressure on the reserve margins in the NEM. The charts only include local generation data and do not include interconnector capacity.
Figure 6: Closure of Coal Fired power stations since 2012 – Cumulative MW removed from the NEM
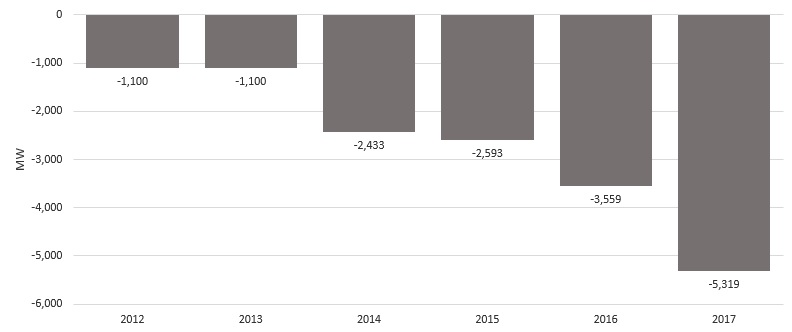
Source: Electricity Gas Australia, 2012-16
Figure 7: Age of operating Coal Fired power stations
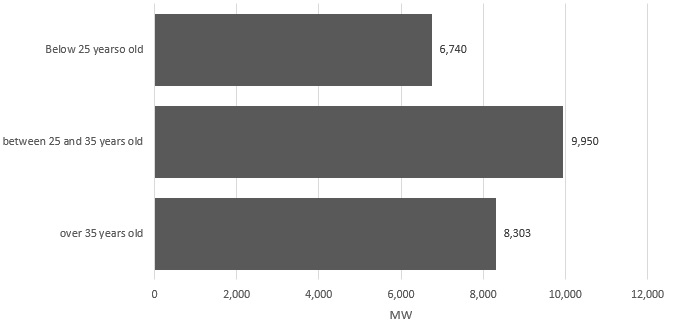
Source: Electricity Gas Australia, 2016
In addition to the decommissioned power stations a number of power stations, some stations have chosen to switch off temporarily, close certain units and/or are being used seasonally, as shown in Figure 8. Generators may prefer to mothball stations rather than permanently remove them from service, particularly given policy uncertainty.
Figure 8: Changes in generating plant’ availability
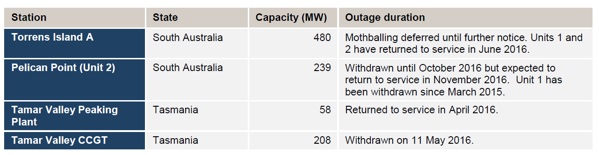
Source: AEMO, 2016
The reserve plant margin data does not include interconnector. There are currently six interconnectors linking the five NEM states. SA is connected to Victoria by two transmission lines, which allow it to source a maximum of approximately 23 per cent of peak load from its eastern neighbour. The QNI link from Queensland to NSW and the NSW interconnector to Victoria allows it to receive imports from both northern states on days of high demand.
[i]AEMO, 2016,”Electricity Statement of opportunities 2016, << https://www.aemo.com.au/-/media/Files/Electricity/NEM/Planning_and_Forecasting/NEM_ESOO/2016/update/2016-ESOO-Update---Hazelwood-Retirement.pdf >>
[ii] ibid
[iii] NEM Review
[iv] Electricity Gas Australia (EGA)
Related Analysis
Retail protection reviews – A view from the frontline
The Australian Energy Regulator (AER) and the Essential Services Commission (ESC) have released separate papers to review and consult on changes to their respective regulation around payment difficulty. Many elements of the proposed changes focus on the interactions between an energy retailer’s call-centre and their hardship customers, we visited one of these call centres to understand how these frameworks are implemented in practice. Drawing on this experience, we take a look at the reviews that are underway.
Data Centres and Energy Demand – What’s Needed?
The growth in data centres brings with it increased energy demands and as a result the use of power has become the number one issue for their operators globally. Australia is seen as a country that will continue to see growth in data centres and Morgan Stanley Research has taken a detailed look at both the anticipated growth in data centres in Australia and what it might mean for our grid. We take a closer look.
Green certification key to Government’s climate ambitions
The energy transition is creating surging corporate demand, both domestically and internationally, for renewable electricity. But with growing scrutiny towards greenwashing, it is critical all green electricity claims are verifiable and credible. The Federal Government has designed a policy to perform this function but in recent months the timing of its implementation has come under some doubt. We take a closer look.
Send an email with your question or comment, and include your name and a short message and we'll get back to you shortly.