

by Panos Priftakis
Queensland and NSW put the heat on demand
In January as a result of statewide mean maximum temperatures well above average[i], Queensland recorded a new all-time peak for electricity demand of 9,412[ii] megawatts (MW) on 18 January. To the south, heatwave conditions pushed New South Wales’ very close to its record peak demand. The amount of power consumed on 10 February was only a few megawatts shy of the 14,764 MW[iii] recorded in the summer of 2010-2011.
The factors driving peak demand are numerous and include both random and typical consumption behaviours, such as the increased use of air conditioners on hot days, business and industry operating hours and daily shifts in outdoor temperatures.
In Queensland, the new record electricity demand was reached with Queenslanders seeking relief from the heat by switching on air conditioning and other appliances to keep cool. While the underlying demand has grown in the state due to new LNG facilities. Another factor being seen is the drop off in availability of solar late in the day.
Even with more solar panels installed, the increased demand from more widespread use of air-conditioners and industrial users (in the case of Queensland) means record electricity demand is increasingly being approached.
In NSW, households load shedding appears to have been avoided as demand spiked by reducing production at the Tomago aluminium smelter and the Visy paper mill at Tumut, which meant that NSW fell just short of the all-time peak demand record. The state in fact only had 44 MW[iv] of unused capacity.
What is the impact on electricity demand of several extremely hot days in a row?
Heatwaves (three or more days of unusually high temperatures) typically place the grid under stress. Not only is demand at or near maximum demand, but high temperatures and heavy loads can impair the operation of key infrastructure like generators and transmission lines. While heatwaves are predictable and therefore can be planned for, dialing the system up to maximum output increases the risk that if something fails, there will be energy shortages. Unscheduled blackouts can occur during these times for these reasons.
Looking at previous heatwaves dating back to 2008, peak electricity demand tends to increase slightly every consecutive day during a major heatwave. Buildings tend to accumulate heat, meaning air conditioners need to work progressively harder each day to achieve the same temperatures.
Looking at the two separate heatwaves in Queensland and NSW, we can see demand increase both as a result of the temperature rising and the actual duration of the heatwave. In most cases a run of three or more hot days[v] with the final day occurring on a week day leads to peak demand being reached. Demand tends to be higher towards the end of January (or February) when schools and businesses have returned to work, and weekdays have higher demand than weekends, as a result of both commercial and industrial demand as well as residential demand.
Figure 1: Queensland Summer peak demand – 2016/17
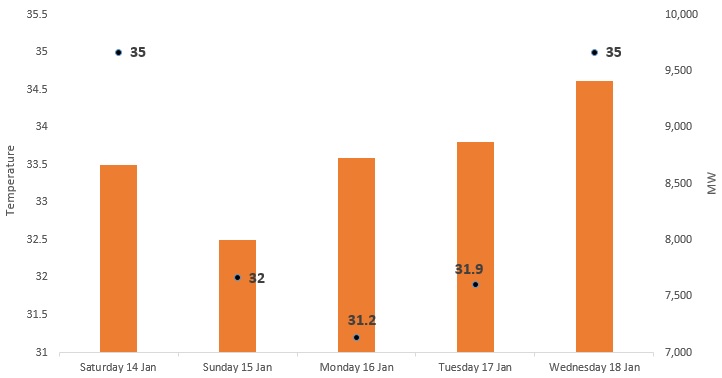
Source: NEM Review, BOM
Figure 2: NSW Summer peak demand – 2016/17
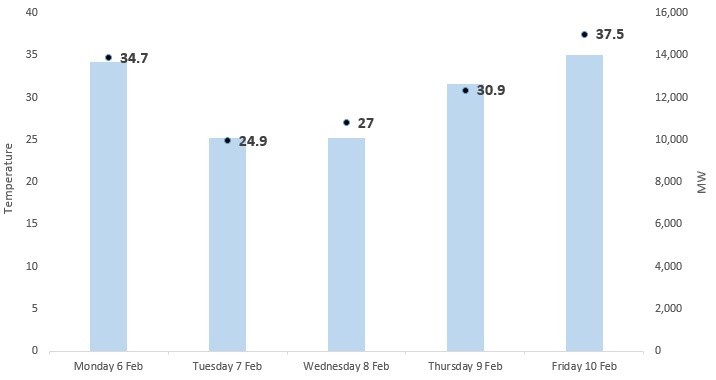
Source: NEM Review, BOM
What is driving this high peak demand?
Air Conditioners
The number one driver of increased electricity demand during heatwaves is air conditioners. Household air conditioners were once a luxury. Now, they are a standard appliance in most Australian homes. Although today’s best air conditioners use 30 per cent to 50 per cent less energy to produce the same amount of cooling as air conditioners made in the mid-1970s it continues to be the largest contributor to peak demand[vi].
Impact of LNG in Queensland and Aluminum smelters in NSW
Despite a decline in energy demand across Queensland predominantly due to rooftop PV, energy efficiency and a range of other factors, the commencement of Queensland’s liquefied natural gas (LNG) facilities has lifted demand and is expected to add more than more than 11 per cent by 2035-36, according to AEMO[vii]. In 2016-17 AEMO expected the LNG facilities to add 9 per cent to peak demand, which would have contributed to the all-time record being reached in January[viii].
Figure 3: Impact of LNG on Queensland Summer peak demand
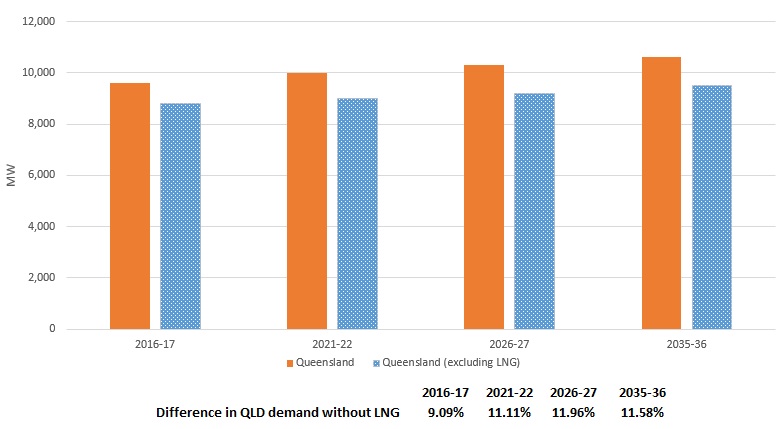
Source: Australian Energy Market Operator, 2016, “National Electricity Forecasting Report – for the National Electricity Market”, June 2016
On the 10 February, during NSW’s peak demand day, the Tomago aluminum smelter and the Visy’s Tumut paper mill reduced demand to ease pressure on electricity supply[ix]. These efforts enabled the power system to provide uninterrupted electricity supply to the region and prevented the need for residential load shedding. The Tomago smelter for the following day also limited electricity use at in a bid to ease pressure on the power grid.
The aluminium industry is energy intensive and the limiting of electricity use for any smelter removes a substantial level of demand. Tomago’s smelter is the largest in Australia and has an average electricity demand of approximately 690 MW per year. Without curtailment at the smelter, NSW would likely have reached an all-time record[x].
In 2014, AEMO revised maximum demand forecasts in NSW as result of the decrease in large industrial consumption from the Kurri Kurri aluminium smelter which closed in early 2014, reducing demand forecasts by 256 MW[xi].
Generation in NSW during 10 February
Although the eventual peak in NSW fell well short of breaking the record of 14,764MW for the state surplus generation in NSW dropped to under 50MW at 7:30pm AEST. Figure 4 below shows the drop in the amount of unused capacity.
Figure 4: NSW unused capacity – 10 February (AEST time)
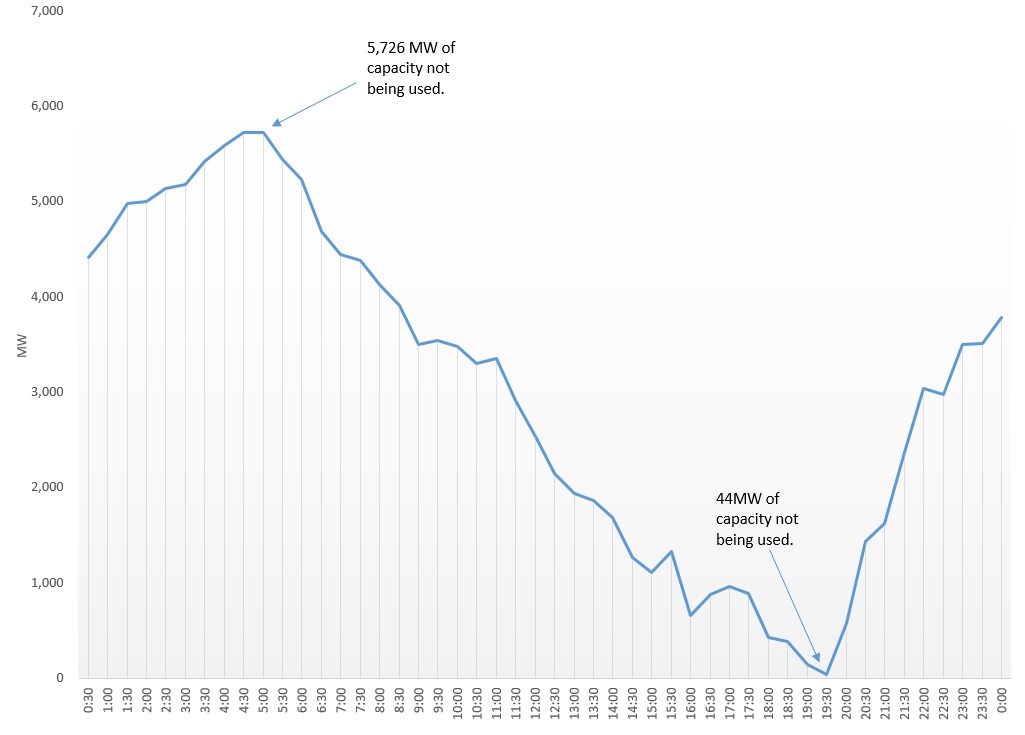
Source: NEM Review
The available generation reflects the maximum output that can be physically produced given real time wind and temperature conditions. Figure 5 shows that the fleet of wind generators in NSW had reduced their output by 7:30pm (falling from a peak output of 517MW at 2pm), with falling wind speeds because of the hot, still summer afternoon conditions. Large-scale solar also was providing minimal electricity by 7:30pm (having fallen from a peak output of 1,102MW at 1:30pm). This meant that 98 per cent generation was coming from coal, gas and hydro generation.
Figure 5: NSW generating capacity – 10h February (AEST time)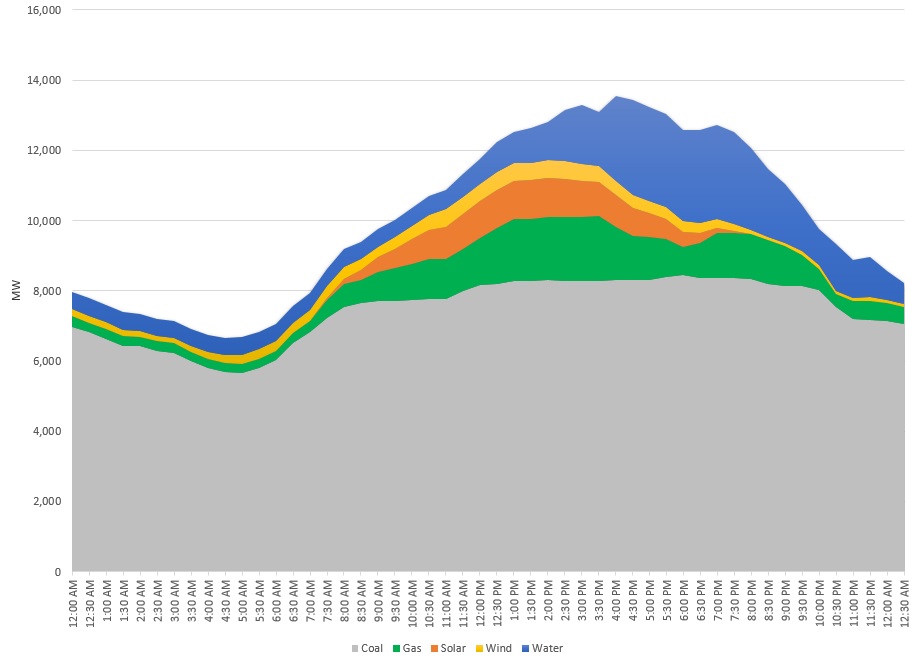
Source: NEM Review
Although there was no load shedding in NSW, as we say the same was not the case in South Australia last week. With SA demand continuing to rise last Wednesday and no further local generation able to be dispatched, and interconnector flows beyond secure levels, AEMO instructed SA Power Networks to begin rolling load shedding.
Impact of Solar
Queensland has for the past few years had the highest residential solar take-up, largely because of the high solar-feed-in tariffs. The impact of solar in Queensland has meant that the peak has occurred later in the day than would have been the case several years ago. Solar PV hollows out scheduled demand when the sun shines. Figure 4 shows that maximum demand has pushed back to later in the day than was the case in 2011.
Figure 6: maximum demand days between 2011-2017
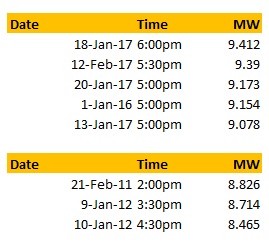
Source: NEM Review
Although Queensland remains the largest rooftop solar state for total installed capacity, the volume of yearly installed capacity has been falling given the amount of homes already with solar in place. Queensland accounts for two-fifths of total installed capacity in Australia and is now sitting at roughly 27 per cent of the national total[xii].
[i] Bureau of Meteorology, Monthly Climate Summary for Queensland
[ii] NEM Review
[iii] Australian Energy Regulator, Seasonal peak demand (region)
[iv] NEM Review
[v] For the purpose of this analysis we assume that a hot day is over 25 degrees.
[vi] https://energy.gov/energysaver/central-air-conditioning
[vii] Australian Energy Market Operator, 2016, “National Electricity Forecasting Report – for the National Electricity Market”, June 2016
[viii] ibid
[ix] http://www.news.com.au/technology/environment/residents-told-to-switch-off-appliances-during-crucial-hours-of-peak-demand/news-story/bb2894aec265b29f3c6280e308313c2b
[x] Turton, H, 2002, “The Aluminium Smelting Industry: Structure, market power, subsidies and greenhouse gas emissions”, Number 44, January 2002 http://www.tai.org.au/documents/dp_fulltext/DP44.pdf
[xi] Australian Energy Market Operator, 2014, “National Electricity Forecasting Report – for the National Electricity Market”, June 2014
[xii] AEC Solar report
Related Analysis
The gas transition: What do gorillas have to do with it?
The gas transition poses an unavoidable challenge: what to do with the potential for billions of dollars of stranded assets. Current approaches, such as accelerated depreciation, are fixes that Professorial Fellow at Monash University and energy expert Ron Ben-David argues will risk triggering both political and financial crises. He has put forward a novel, market-based solution that he claims can transform the regulated asset base (RAB) into a manageable financial obligation. We take a look and examine the issue.
Australia’s Sustainable Finance Taxonomy: Solving problems or creating new ones?
Last Tuesday, the Australian Sustainable Finance Institute (ASFI) released the Australian Sustainable Finance Taxonomy – a voluntary framework that financiers and investors can use to ensure economic activity they are investing capital in is consistent with a 1.5°C trajectory. One of the trickier aspects of the Taxonomy was whether to classify gas-powered generation, a fossil fuel energy source, as a “transition” activity to support net-zero. The final Taxonomy opted against this. Here we take a look at how ASFI came to this decision, and the pragmatism of it.
Gas in the NEM: Is there a case for a new and expanded RERT?
Gas-powered generation (GPG) will be essential to maintaining reliability in the National Electricity Market (NEM) as coal exits and the grid becomes increasingly reliant on variable renewable energy (VRE) and storage. However, current market settings and investment mechanisms are failing to support the GPG capacity needed for both regular firming and emergency insurance against high-impact, low-probability (HILP) VRE droughts. We take a closer look at whether a new and expanded Reliability and Emergency Reserve Trader (RERT) framework could provide a viable pathway to deliver insurance GPG outside the market without distorting competitive outcomes.
Send an email with your question or comment, and include your name and a short message and we'll get back to you shortly.