

by Carol Tran
NEM demand in the time of COVID-19
Australia’s COVID-19 response, with lockdowns between and within the states, means many of the nation’s economic activities have encountered new challenges, with many people working from home and commercial premises empty.
A point of widespread interest is how the lockdown is affecting energy demand – one of the best ways to track social and economic events. In the worst affected countries, significant falls in energy demand have occurred.
Figure 1:
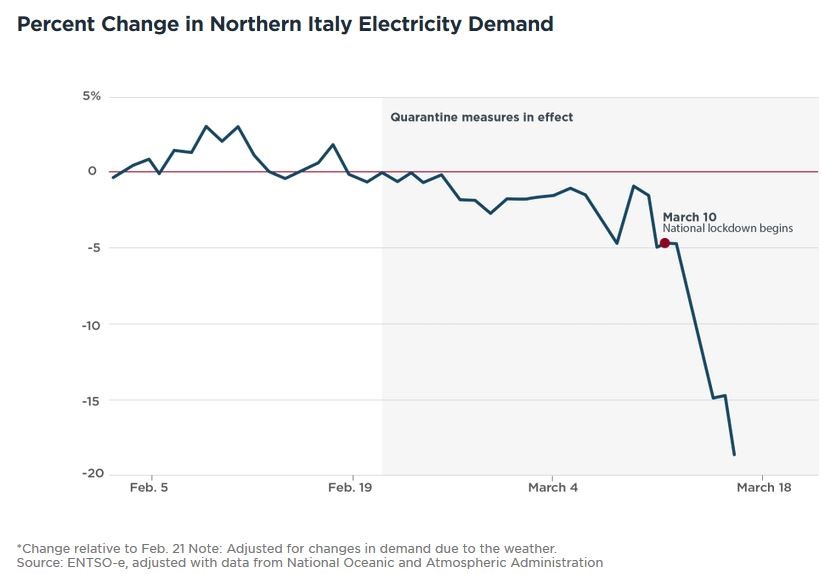 Source: University of Chicago Energy Policy Institute
Thankfully Australia’s situation is nowhere near as bad as Northern Italy, and, at this stage, the changes in energy consumption are much smaller. It may still be too early to fully detect the impacts of the lockdown on the National Electricity Market (NEM), but information on electricity demand over the last four weeks can provide some useful insights.
Since the Australian COVID-19 rules have come into progressive effect since mid-March, there has been considerable public commentary on early signs of changes in NEM demand[i]. These have tended to be rather equivocal: fairly small effects lost in the normal day to day fluctuations. It is now however becoming clearer. Below we take a look at the most recent data, with insights that can help to inform future assessments. In particular, we have attempted assess underlying demand by removing the effects of rooftop solar whose output changes with cloud cover.
So what insights can we draw Australia’s real-time electricity consumption? Below we take a look.
March: Overall trends
As defined by the Australian Energy Market Operator (AEMO):
- Operational demand refers to all the demand as supplied by large generators on the grid (what many people call “grid demand”). This falls when the sun shines over a city.
- Underlying demand refers to all electricity consumed and can be provided by localised generation from behind-the-meter solar, battery storage, and embedded generators, or by the electricity grid. As rooftop solar output is not separately metered, an estimate is used.
Figure 2 below, which compares March 2020 to the same period over the last four years, shows that across the NEM states the underlying demand (charts on right) has been offset by solar generation, shifting the grid peak to later in the day (charts on left). This effect has grown very substantially in the last four years. It is however is due to the progressive growth of solar and is not COVID-19 related.
This March saw underlying demand (black line) largely drop compared to 2019’s underlying demand (red line). This trend will grow as corporate and manufacturing facilities continue to close or vastly reduce their power use, offsetting higher demand from households due to more people staying indoors.
Except for New South Wales, 2020’s underlying demand (black line) remains close to 2018 (yellow line). Though the underlying demand is lower than recent years, it is a surprisingly small reduction – so, if we explain electricity demand as an indicator of economic activity, Australia is nowhere near turning the lights off yet.
Figure 2: Operational demand (left) and underlying demand (right) trends in March over the past four years
New South Wales 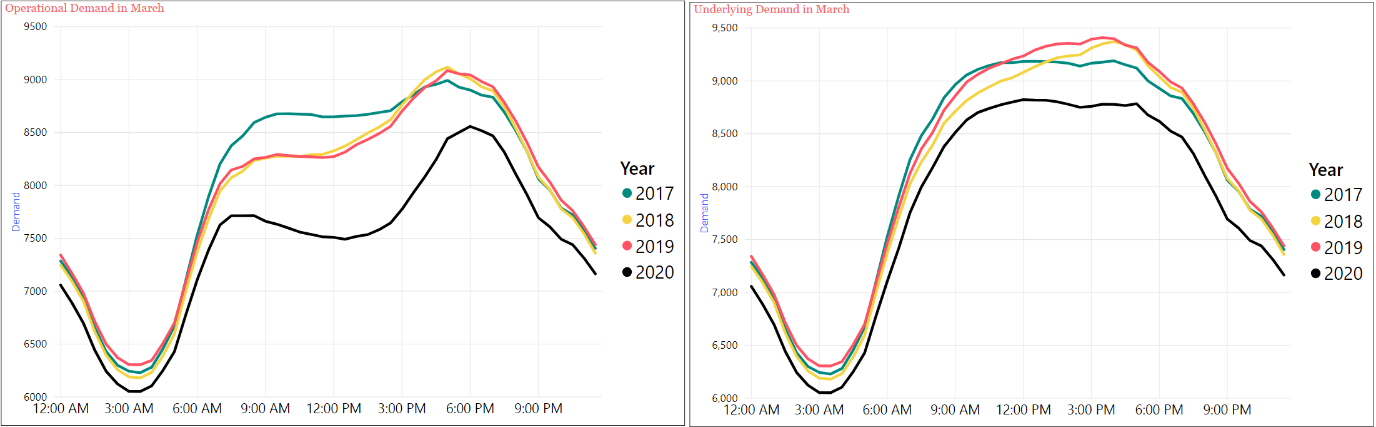
Queensland 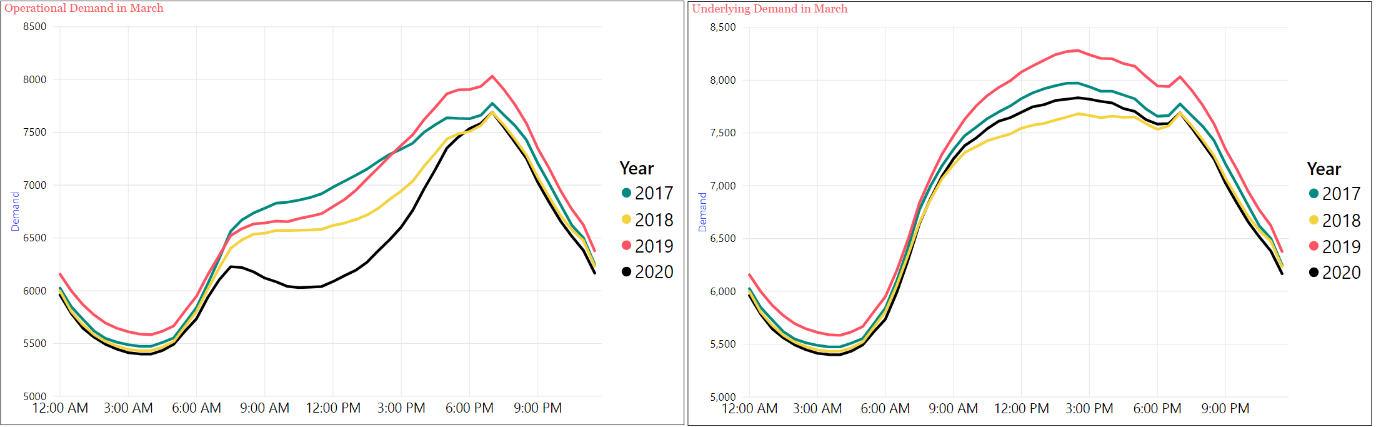
South Australia 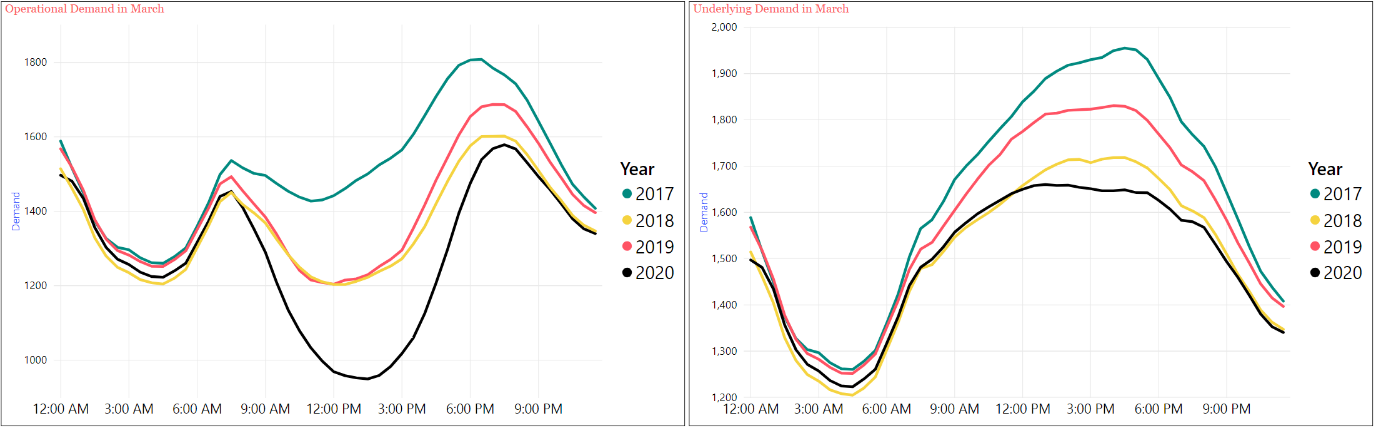
Tasmania 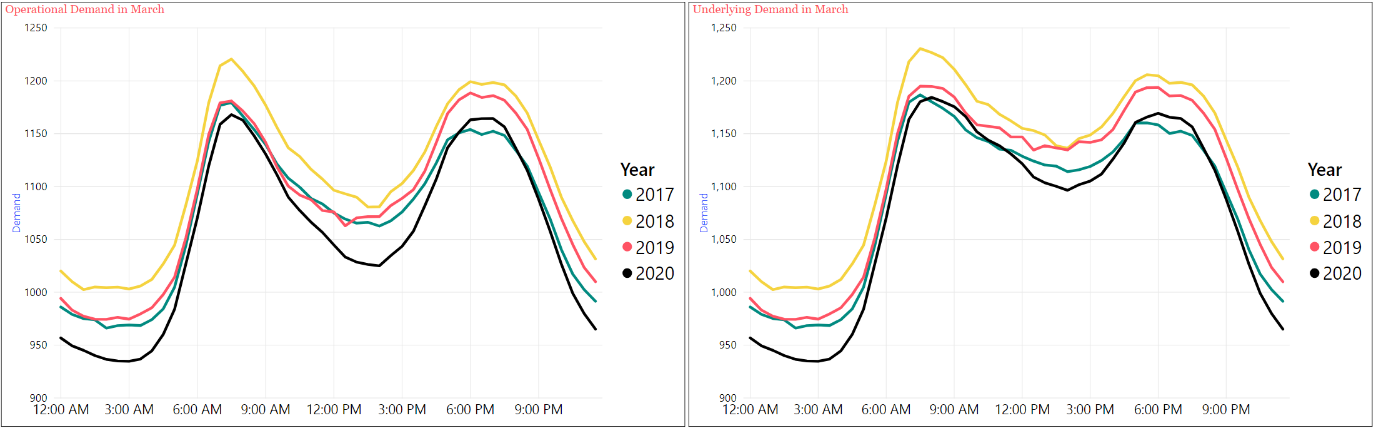
Victoria 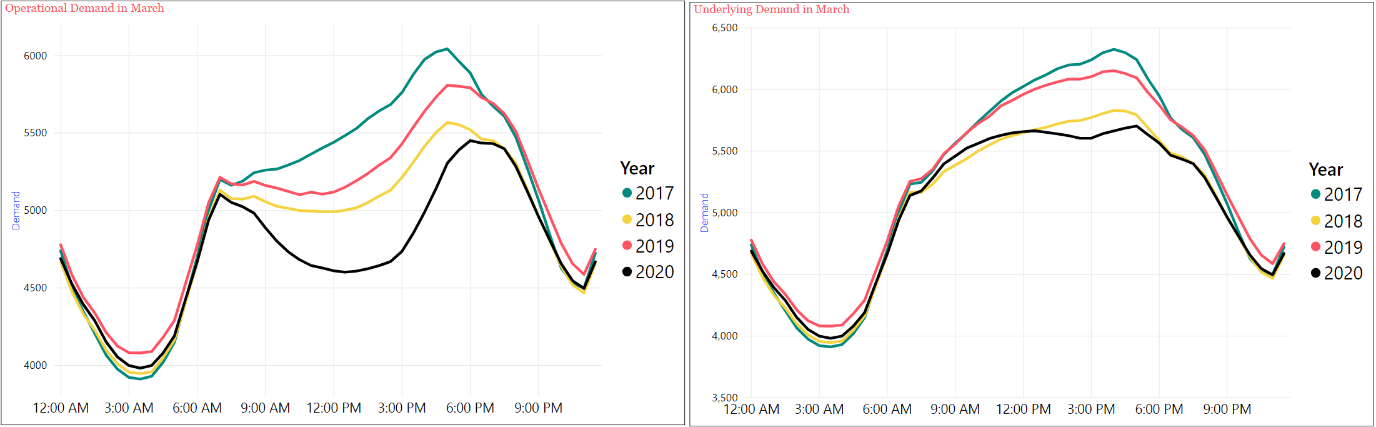 Source: AEC analysis (demands averaged across March)
Week by week comparison
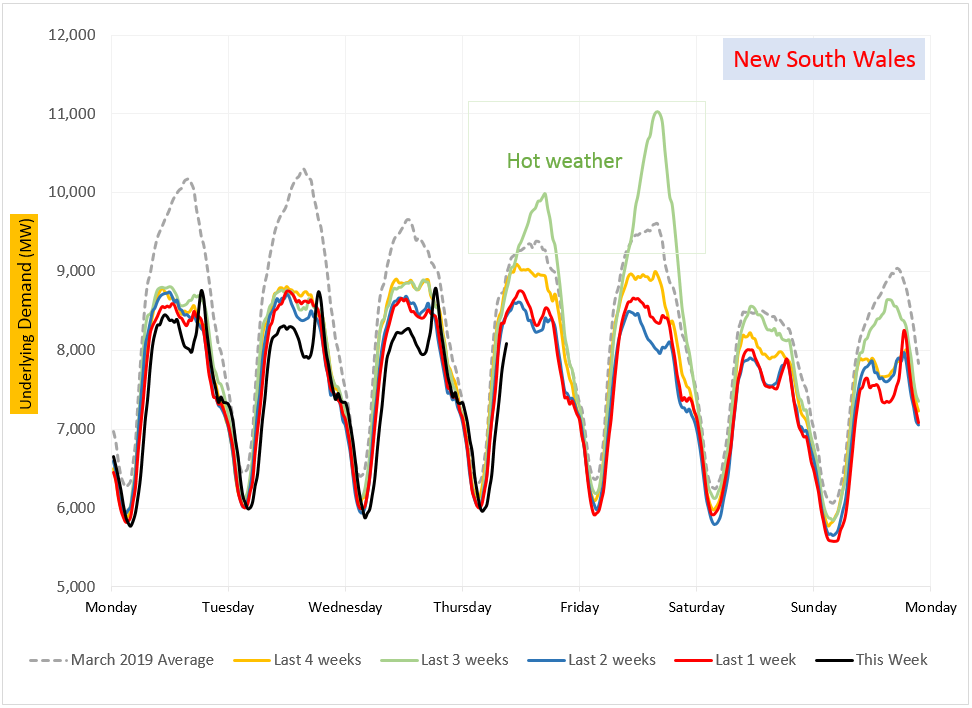
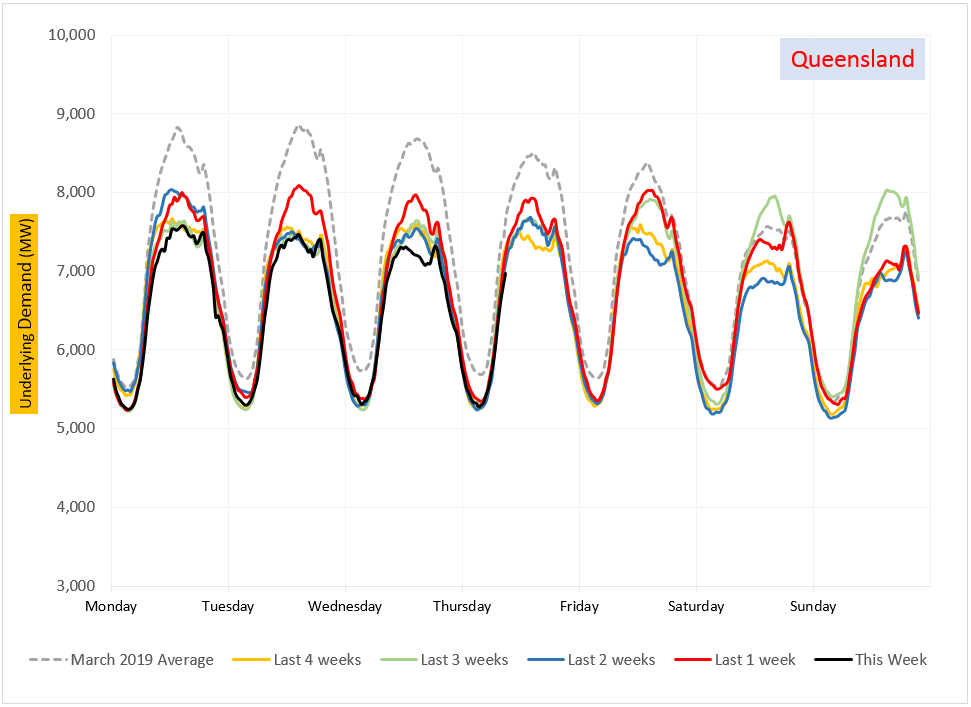
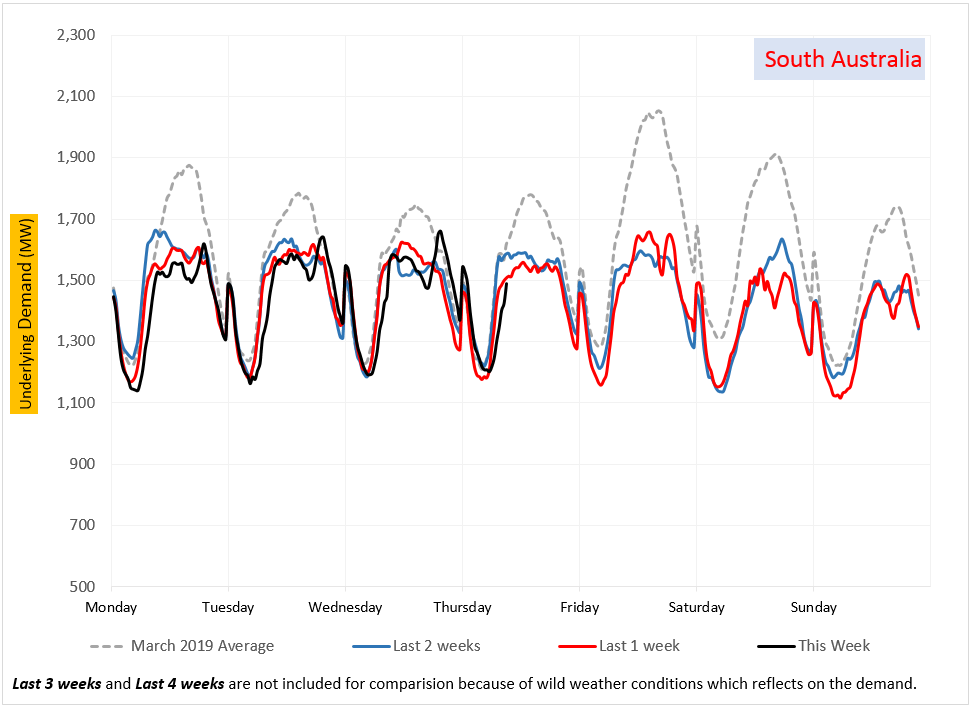
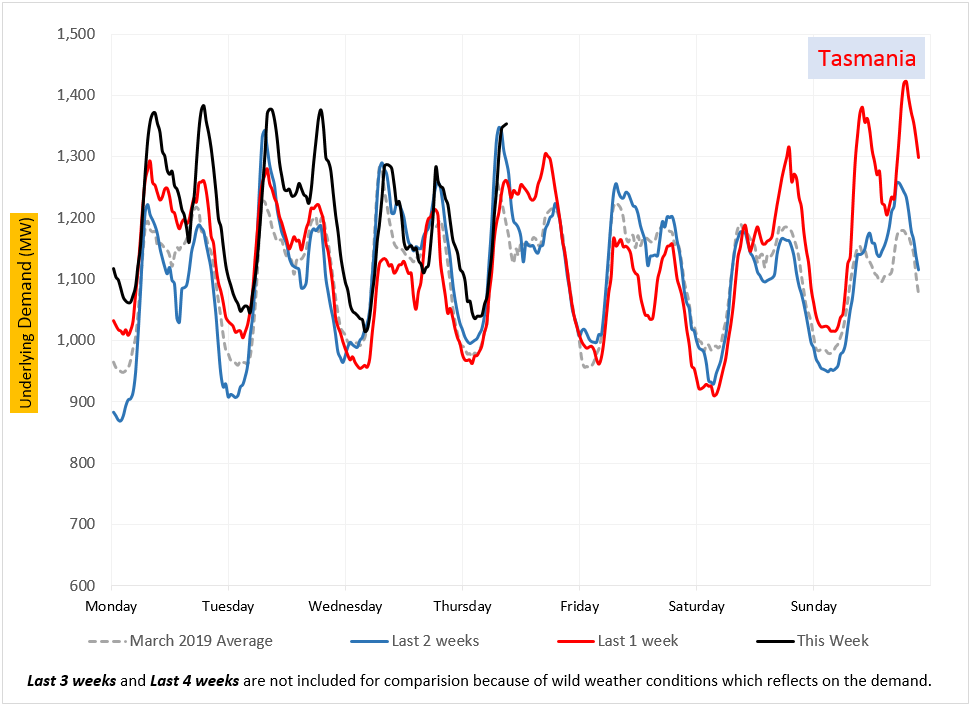
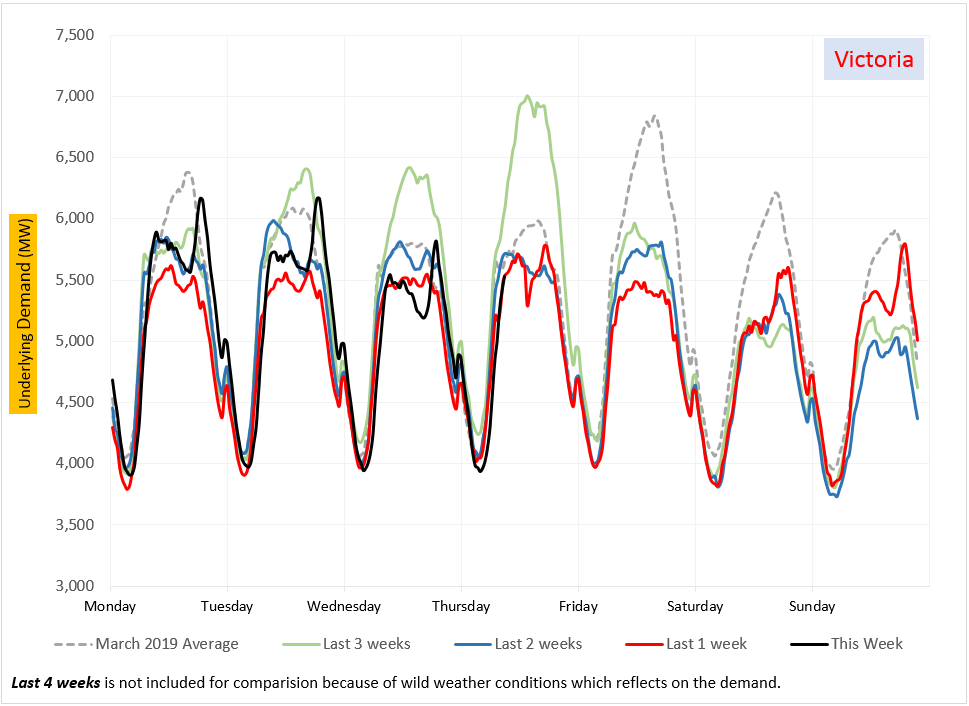
Amid progressively stronger lockdowns, shutdowns and working from home, electricity demand across the NEM states surprisingly shows only a small reduction. A week-by-week comparison further illustrates this reduction (figure 3). Key points are:
- All times shown are Eastern Standard Time. The conclusion of daylight savings on 5 April (not Queensland) would have a small effect on the demand shape, by shifting business hours to one hour later.
- In general, the weekday demand has progressively fallen week on week, but not dramatically and not consistently.
- There is a short trough in underlying demand around 4pm, which began to emerge a week ago, before the end of daylight savings. The cause of this is not yet clear. A strong evening peak at 6:30pm has re-emerged in the week commencing 6 April in all states except Queensland. This coincides with colder weather. As this is outside business hours, it confirms that residential load is strong. Larger cooking load is another possible explanation, with people more likely to be eating at home due to lockdowns.
- Tasmanian load increased substantially from Saturday 4 April as a strong cold front brought snow to the highlands.
Figure 3: Week by week comparision on underlying demand across the NEM states
This week: 6 April – 12 April (school holidays)
Last 1 week: 30 March – 5 April (school holidays, further restrictions across the states)
Last 2 weeks: 23 March – 29 March (schools closed early on Tuesday in Victoria)
Last 3 weeks: 16 March – 22 March (before COVID-induced lockdowns)
Last 4 weeks: 9 March – 15 March (before COVID-induced lockdowns)
 Source: AEC analysis
The nation’s lockdown response has been progressively enforced recently. Impacts in demand at this stage are too early to draw concrete conclusions, however as we continue to move through the different stages of restrictions, demand will remain a point of interest to watch.
And even when the lockdown is lifted, the COVID-19 pandemic is likely to have impacts on energy demand for years to come. Australia is facing a major recession, hopefully somewhat offset by an unprecedented stimulus package. Previous economic downturns have substantially depressed demand growth, and whilst it is far too early to tell yet, there are likely to again be major repercussions.
[i] http://www.wattclarity.com.au/articles/2020/03/2nd-thoughts-on-covid-19/
Related Analysis
2025 Election: A tale of two campaigns
The election has been called and the campaigning has started in earnest. With both major parties proposing a markedly different path to deliver the energy transition and to reach net zero, we take a look at what sits beneath the big headlines and analyse how the current Labor Government is tracking towards its targets, and how a potential future Coalition Government might deliver on their commitments.
Retail protection reviews – A view from the frontline
The Australian Energy Regulator (AER) and the Essential Services Commission (ESC) have released separate papers to review and consult on changes to their respective regulation around payment difficulty. Many elements of the proposed changes focus on the interactions between an energy retailer’s call-centre and their hardship customers, we visited one of these call centres to understand how these frameworks are implemented in practice. Drawing on this experience, we take a look at the reviews that are underway.
Data Centres and Energy Demand – What’s Needed?
The growth in data centres brings with it increased energy demands and as a result the use of power has become the number one issue for their operators globally. Australia is seen as a country that will continue to see growth in data centres and Morgan Stanley Research has taken a detailed look at both the anticipated growth in data centres in Australia and what it might mean for our grid. We take a closer look.
Send an email with your question or comment, and include your name and a short message and we'll get back to you shortly.