

by Nick Leys
HILDA Survey: Have the dynamics of home energy spending changed?
Rising power bills and the reasons for increases have featured prominently in recent public discussion about the cost of living in Australia. The National Energy Guarantee (NEG) and last month’s Australian Competition and Consumer Commission (ACCC) report into electricity prices have primed consumers and the cost of living will play a key role in upcoming election campaigns in Victoria (November) and NSW (March next year) before a Federal election by the end of May next year at the latest.
Lost in the heated debate over the NEG and the ACCC Recommendations was the release of the University of Melbourne’s 2018 Household, Income and Labour Dynamics in Australia (HILDA) Survey, a longitudinal study that collects valuable information from Australian households about economic, personal well-being, labour market dynamics and family life.
The HILDA Survey
The survey follows the lives of more than 17,000 Australians each year and collects information on many aspects of life in Australia, including household and family relationships, income and employment, and health and education. Participants are followed over the course of their lifetime.
A key line of inquiry is household economic wellbeing and the causes of financial stress. One question in the survey asks respondents if a shortage of money had meant electricity, gas or telephone bills could not be paid on time.
The latest HILDA survey shows that mean expenditure on home energy rose from 2006: from $1727 a year (at December 2016 prices) to $2118 in 2015-2016. But it was higher, in real terms, in the 2013-2014 period, when bills reached $2185. The drop-off after 2014 indicates consumers became more aware of higher costs and found ways to adapt to the higher prices.
The survey concludes that households have lowered their energy consumption through the use of energy-efficient appliances, installing solar panels, home insulation and LED lights. And perhaps households are returning to tried and true methods like turning lights off and heating fewer rooms in winter.
Data also confirms that households earning higher incomes spend less on energy as a percentage of that income and their spend on electricity has not shifted greatly. The mean expenditure share of income in 2006-2008 was 1.2 per cent and this had increased marginally to 1.4 per cent in 2015-2016, suggesting that they have not changed their consumption patterns greatly given it does not appear to be as much of a pressure point at higher income levels.
According to ABS data, total electricity costs represent 2.17 per cent of overall incomes (as previously discussed in Electricity 2.17 per cent of average household expenditure). A comparison of mean expenditure on household energy as a share of income (see table 1) unsurprisingly shows that the share of income spent on energy bills declines as income increases. Energy makes up a large share of household income in the bottom 20 per cent for income distribution at four times the amount of the top income quintile.
Table 1: Comparison of mean expenditure on household energy as a share of income
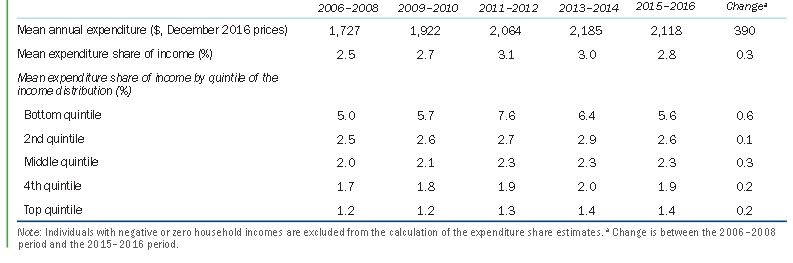 Source: HILDA Survey
And despite the decline in energy spend over the past decade, bills remain higher as a percentage for the lowest earning households than higher income households.
The biggest increase in the percentage of income required to meet power bills was amongst the bottom quintile where it increased from 5 per cent to 5.6 per cent. This group also has reduced their spend on electricity the most of any income group. Between 2011-2012 and 2015-2016 the percentage spend by this income group on electricity fell by 2 per cent. In 2011-2012 power bills consumed 7.6 per cent of income, and by 2015-2016 this had fallen to 5.6 per cent (which is still 3 per cent more than the share of income for the second quintile).
In other words, the average share of household expenditure on electricity has increased by 9 per cent over the past six years, while gas and other fuels has increased by 21 per cent. Combined, they now account for, on average, 3.04 per cent of total household spending (for more details see: “Electricity: 2.17 per cent of average household expenditure”).
According to the revised CPI basket, this is still well less than household spending on alcoholic beverages (4.49 per cent) or eating out and take-away food (5.88 per cent). Including water rates (1.02 per cent), the average Australian household spends less on utilities than it does on holidays (5.83 per cent) or education (4.27 per cent). Energy takes up less of household spending than other “essential services” like food (16.09 per cent) and housing (18.62).
Conclusion
The Hilda survey highlights that as an essential non-discretionary purchase, energy price rises impact more acutely on lower income and more vulnerable households.
It is imperative that the most vulnerable households are assisted in the management of their energy bills, and that all consumers are able to understand how to make the best decisions for their energy needs. This important and ongoing work continues to be a priority for both policymakers and the industry. Today it was reported that the Reserve Bank’s deputy governor Guy Debelle believes that a decade of indecision on Australia’s energy policy has added uncertainty to the assessment on the outlook for inflation. And this uncertainty has led to under-building of new supply and a sharp rise in energy prices in recent years[i].
The Hilda Survey found that the spending on energy actually peaked in 2013-2014 and has since declined in real terms. One of the lead authors Roger Wilkins said “one thing that surprised me was that the HILDA data is showing that people’s expenditure actually peaked in around 2014. So since then people have actually been decreasing their expenditure, in real terms at least, adjusting for inflation.
“So that was something that I wasn’t expecting because there’s been a lot of recent media about prices continuing to rise since 2014 and yet expenditure hasn’t been rising since 2014.”
They attribute this reduction to people adapting to higher prices by buying energy efficient appliances, insulating their homes, installing solar panels (growth in solar PV installations, which was highlighted last week by our most recent Solar Report), while others may be doing things like heating less rooms in winter to keep their energy bills down.
[i] https://www.energycouncil.com.au/media/13497/998790236.pdf
Related Analysis
OECD Price Comparison: How do we stack up?
As households and small businesses are notified of changes to their energy prices for the financial year, there continues to be scrutiny of our power prices. With energy affordability an ongoing concern for Australians, comparisons with overseas energy markets are common with consideration of how Australia's costs compare to other countries. We take a look at how our electricity prices stack up against other developed nations using the latest data across 38 OECD countries.
Principles-based regulations: What are the opportunities and trade-offs?
As Australia’s energy market continues to evolve, so do the approaches to its regulation. With consumers engaging in a wider range of products and services, regulators are exploring a shift from prescriptive, rules-based models to principles-based frameworks. Central to this discussion is the potential introduction of a “consumer duty” for retailers aimed at addressing future risks and supporting better outcomes. We take a closer look at the current consultations underway, unpack what principles-based regulation involves, and consider the opportunities and challenges it may bring.
Energy Retail: Meeting the Future Needs of Energy Consumers
The electrification of everything, responsive demand and energy storage, the rise of prosumers and digitalisation and the evolving regulatory framework are all changing the landscape for energy consumers, making it clear that the traditional energy only retail model is not likely to meet all of consumers’ needs in a high consumer energy resources (CER) world. Currently, the AEC and its members are in the midst of a series of projects which will help consumers find the connections they need. What are are they and how will they help? We take a closer look.
Send an email with your question or comment, and include your name and a short message and we'll get back to you shortly.