

by Panos Priftakis
Emissions in cities and national targets: By the numbers
National carbon emission targets are notoriously difficult to compare. Now individual cities are proposing to set and compare their own mini league of emissions reduction targets. A number have committed to being the first carbon neutral city in the world, with sweeping city-by-city commitments made at the Paris climate talks last year. Tackling greenhouse emissions from cities is important, producing emissions both directly from point sources (cars, industrial activity) and indirectly from the emissions released in the supply of gas and electricity. But can you really compare cities against each other? Can they have a meaningful and measurable carbon race to the carbon neutral finish line?
The emissions starting line for every city will vary significantly, depending on a range of largely geographical factors: its size and density, transport infrastructure, affluence, weather patterns and proximity to different electricity generation fuels (for example, hydro, geothermal and nuclear vs brown and black coal). Most cities import electricity from grids which can cross state and national boundaries. The source of electricity can ebb and flow with different weather patterns and demand conditions. Vancouver in Canada is ringed by hydro generation and so is already well advanced in the carbon neutral race without doing anything, while Melbourne with its strong reliance on brown coal, starts the race towards the back of the field.
A focus on cities
The role cities play in cutting emissions was given a high profile during the UNFCCC Convention of Parties meeting in Paris in December. This included the Compact of Mayors[i], the Compact of States and Region and EnergyCities[ii], promoting cities and regions as a primary focus of carbon abatement effort globally.
Cities around the world are now setting their own greenhouse targets. The C40[iii] Cities Climate Leadership Group is a network of the world’s largest cities that are committed to addressing climate change[iv]. According to the C40, the City of Melbourne is aiming to be carbon neutral by 2020[v], while Sydney is aiming to reduce its emissions by 70 per cent over 2006 levels by 2030[vi]. Adelaide recently proposed to become the world’s first carbon neutral city by 2050 in a South Australian Government strategy to tackle climate change[vii]. Yet Copenhagen is aiming to be carbon neutral by 2025[viii]. Oslo is targeting carbon neutrality for its space heating task by 2020 and for most other sectors by 2050. Stockholm aims to be “a fossil fuel free city by 2050”[ix].
City targets – which numbers?
A major challenge is data reliability and comparability. Basically, reliable and comparable emissions data for cities does not exist. The World Bank and the Carbon Disclosure Project (CDP) data for representative GHG Baselines for Cities and municipalities is presented in different base years. For Australian data there is no comparable city emissions data.
In some cases cities, such as the City of Melbourne, set their targets based on their municipality. This is a political boundary inside the loose geographical boundary that defines cities in the first place. Setting emissions for city-wide data though in comparison to municipalities leads to very different results and targets. Figure 1 and 2 present’s emissions per capita data from the World Bank and CDP. In figure 1 the municipality of Sydney is one the best performing cities for emissions per capita although World Bank data on figure 2 has Sydney as the worst performing city around the world.
Figure 1: Municipal - GHG Emissions (tCO2e/capita), CDP Cities 2013 data (different base years)
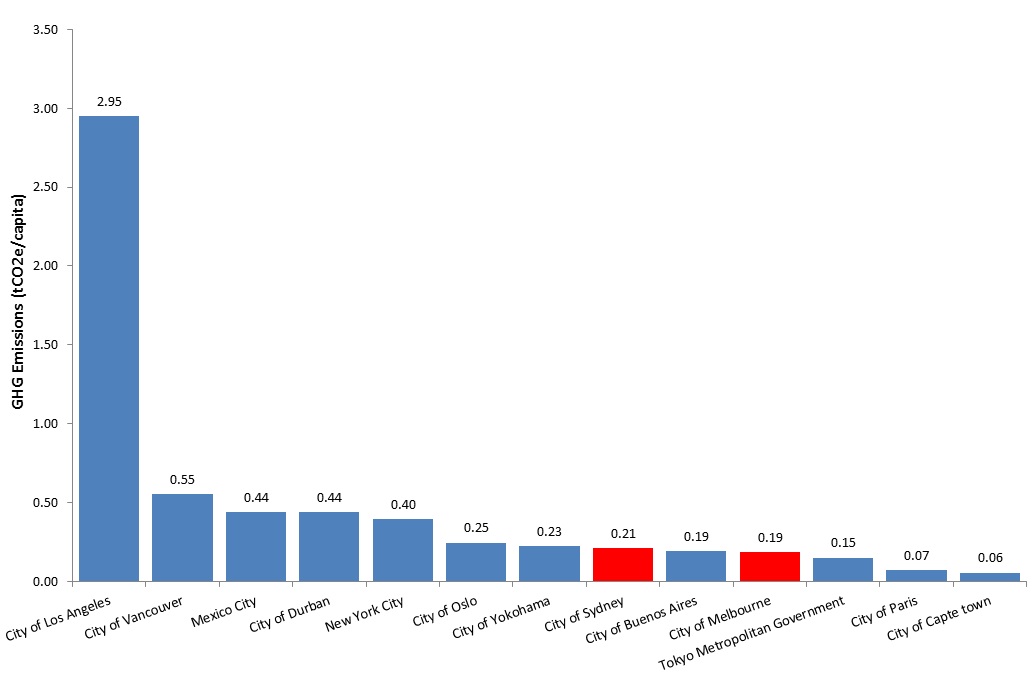
Figure 2: Cities - GHG Emissions (tCO2e/capita), World Bank data (different base years)
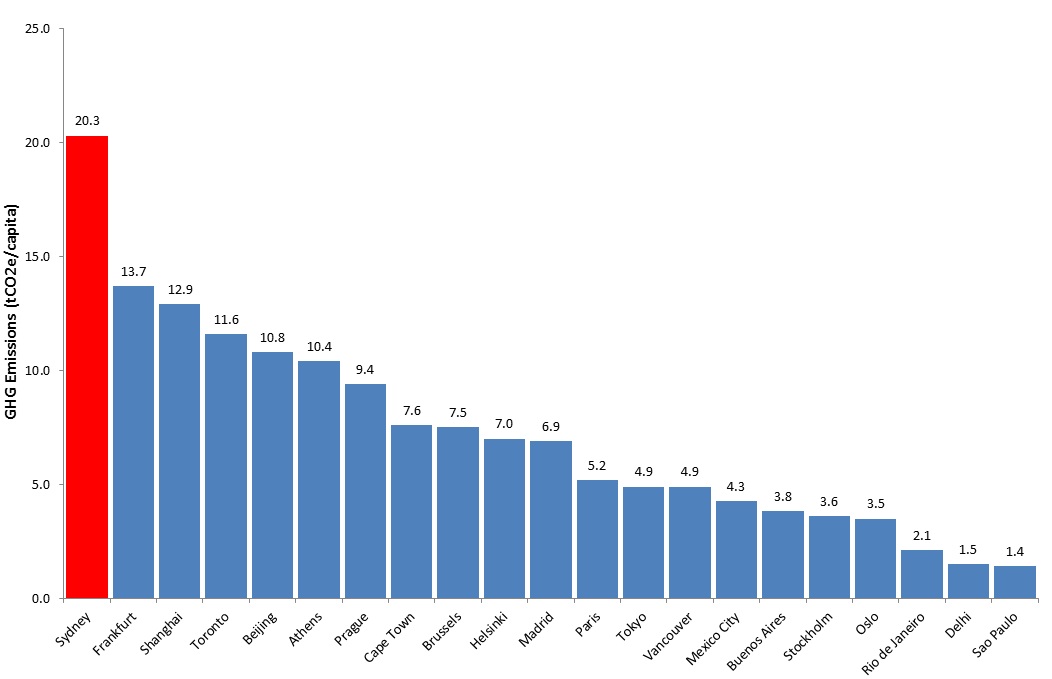
Accurate city-level data appears to be hard to find, incomplete or unreliable as can be seen in Figures 1 and 2. Although even if the data was more reliable, a comparison may not be helpful due to the wide variety in the infrastructure cities are endowed with – power, transport, population density, etc.
Part of the issue with municipal commitments and the subsequent GHG inventories is that the municipal governments do not have control over most of the emissions within the city. Different city governments have different roles and responsibilities, in other countries some do have direct control over the electricity mix that they consume. Sacramento in California has more than most, because it owns the local power company including much of the generation[x]. There are few cities that have enough control for total emissions targets to be useful metric for them.
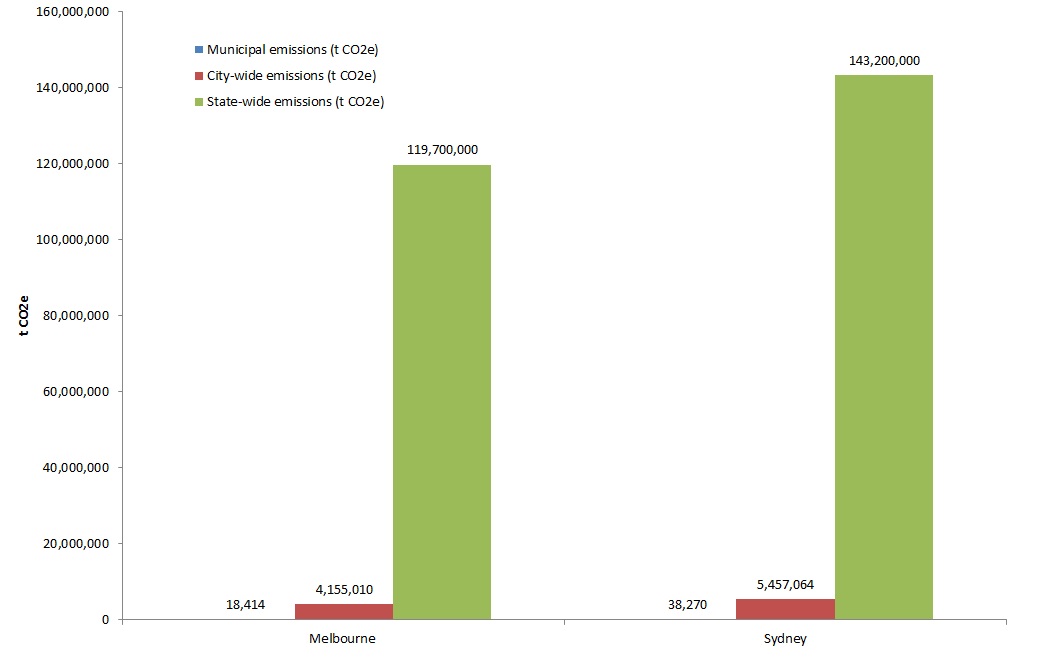
The difficulties and distortions in the way city emissions can be calculated and reported are shown in Figure 3. Emissions for municipal Melbourne are dramatically lower than for what most would consider to be Melbourne – the metropolitan area. Figure 3 also includes state-wide emissions. Latrobe Valley power generation would account for a significant proportion of state-wide emissions and while Melbourne is the major source of the demand for the electricity this has not been factored into the emissions for either municipal or metropolitan Melbourne, rendering the emission statistics and targets meaningless.
Figure 3: Cities, Municipal and State - GHG Emissions tCO2e for Sydney and Melbourne
Having municipal and city targets is not only confusing, it adds little to the state and national targets. National approaches are inherently more efficient than having a variety of state, city and municipal approaches to reducing greenhouse gas emissions from the stationary energy sector and/or deploying low or zero emissions technologies. Several different schemes are likely to distort investment incentives between different regions/cities resulting in sub-optimal outcomes economy wide.
Why are we ranking cities?
Cities’ will play a role in bringing a solution to reducing emissions, but ranking cities and setting targets for each city is both misleading (as can be seen in Figure 2 where the zero emissions target for Sao Paulo, for example, can be met much more easily than in Sydney) and meaningless. It appears to be more of a public relations exercise than a means to tackle the major sources of carbon emissions in an economy.
What cities can do?
It would be best for each city to focus on more specific objectives that it can do that can assist with reducing emissions and then set its targets accordingly, if they are helpful. This might include: planning laws and decision-making including ease of installing low/zero emissions generation, promotion of public transport and cycling/walking and orienting its own procurement practices to lower emissions alternative like buying GreenPower.
[i] http://www.compactofmayors.org/
[ii] http://www.theclimategroup.org/what-we-do/programs/compact-of-states-and-regions/
[iii] C40 cities represent 25% of global GDP and 1 in 12 people worldwide, and their actions are leading to hundreds of millions of tonnes of greenhouse gas abatement. The cities share research, resources and information through a range of networks, with the aim of providing mutual support for cities to reach their abatement goals. There are 75 cities that are members of C40.
[iv] http://www.c40.org/
[v] City of Melbourne, 2014, “Zero Net Emissions by 2020”
[vi] CDP, 2015, “Sydney in Focus: City of Sydney”, CDP Cities 2015 Report
[vii] South Australian Government, 2015, “Carbon Neutral Adelaide: A shared vision for the world’s first carbon neutral city”
[viii] http://www.c40.org/profiles/2013-copenhagen
[ix] http://www.c40.org/
[x] www.smud.org
Related Analysis
Climate and energy: What do the next three years hold?
With Labor being returned to Government for a second term, this time with an increased majority, the next three years will represent a litmus test for how Australia is tracking to meet its signature 2030 targets of 43 per cent emissions reduction and 82 per cent renewable generation, and not to mention, the looming 2035 target. With significant obstacles laying ahead, the Government will need to hit the ground running. We take a look at some of the key projections and checkpoints throughout the next term.
Certificate schemes – good for governments, but what about customers?
Retailer certificate schemes have been growing in popularity in recent years as a policy mechanism to help deliver the energy transition. The report puts forward some recommendations on how to improve the efficiency of these schemes. It also includes a deeper dive into the Victorian Energy Upgrades program and South Australian Retailer Energy Productivity Scheme.
2025 Election: A tale of two campaigns
The election has been called and the campaigning has started in earnest. With both major parties proposing a markedly different path to deliver the energy transition and to reach net zero, we take a look at what sits beneath the big headlines and analyse how the current Labor Government is tracking towards its targets, and how a potential future Coalition Government might deliver on their commitments.
Send an email with your question or comment, and include your name and a short message and we'll get back to you shortly.