Electricity prices around the world: What is the impact of renewable charges?
Businesses and households in many countries are investing money into renewable sources of electricity, such as wind and solar. Subsidies to encourage a higher penetration of renewable energy is showing in high household energy prices in some countries. Denmark and Germany, with high levels of renewable generation in their energy mix, also now face the highest energy prices in the world. In Germany, solar photovoltaic (PV), biomass plants and wind have received the largest share of the feed-in tariffs payable and reflected in German power prices in 2015, while in Denmark, the public subsidies paid by electricity consumers (which represent about AUD10 cents/kWh) to support renewables are expected to increase further if plans are followed to establish a large number of wind turbines in coastal areas. Despite the impact of renewable charges on electricity bills it remains one component of many and is not always the cause of higher prices.
In Australia, the cost of renewables currently represents a tiny band on the percentage of consumers energy bills. Between 2004-2014 energy price increases were largely caused by investment in network infrastructure rather than any renewable charges. Green schemes such as feed-in tariffs (FiTs) having a small impact on consumers electricity bill.
One example is Queensland, where renewable schemes currently account for less than 10 per cent of the total electricity bill. Although with the Queensland government committing to investigating a renewable energy target of 50 per cent by 2030, it is unclear what impact this will ultimately have on electricity prices. While the State’s expert panel on renewables forecast that additional renewable energy would be cost neutral for consumers, this was based on an assumption that no existing thermal power plants would close.
International Energy Agency Household electricity prices
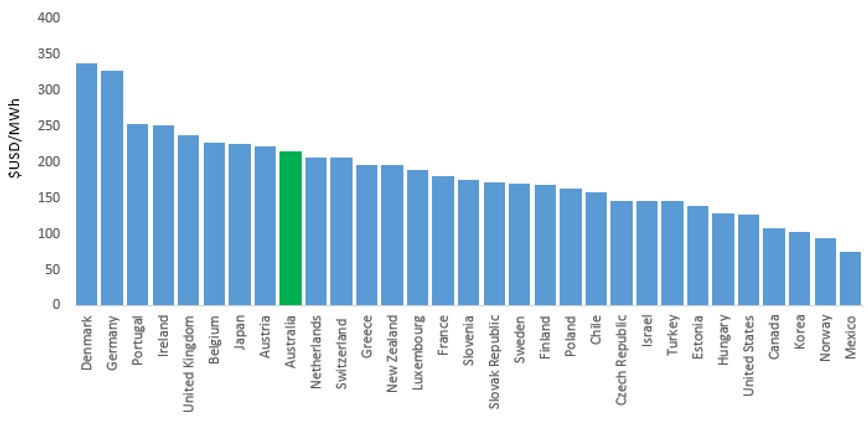
A recent comparison of electricity household prices around the world by the International Energy Agenecy (IEA) has found that Denmark and Germany have the highest electricity prices, with Australia ranking 9th highest. Figure 1 shows the rankings from highest to lowest prices across 31 different countries[i]. It is important to note that the market exchange rate which appears to be used can move around and therefore change the rankings.
Figure 1: Electricity for households (MWh) prices ($USD/MWh) for 31 different countries – 2015 annual data
Source: International Energy Agency, “Key world energy statistics 2016”, Australian Energy Council analysis, 2016
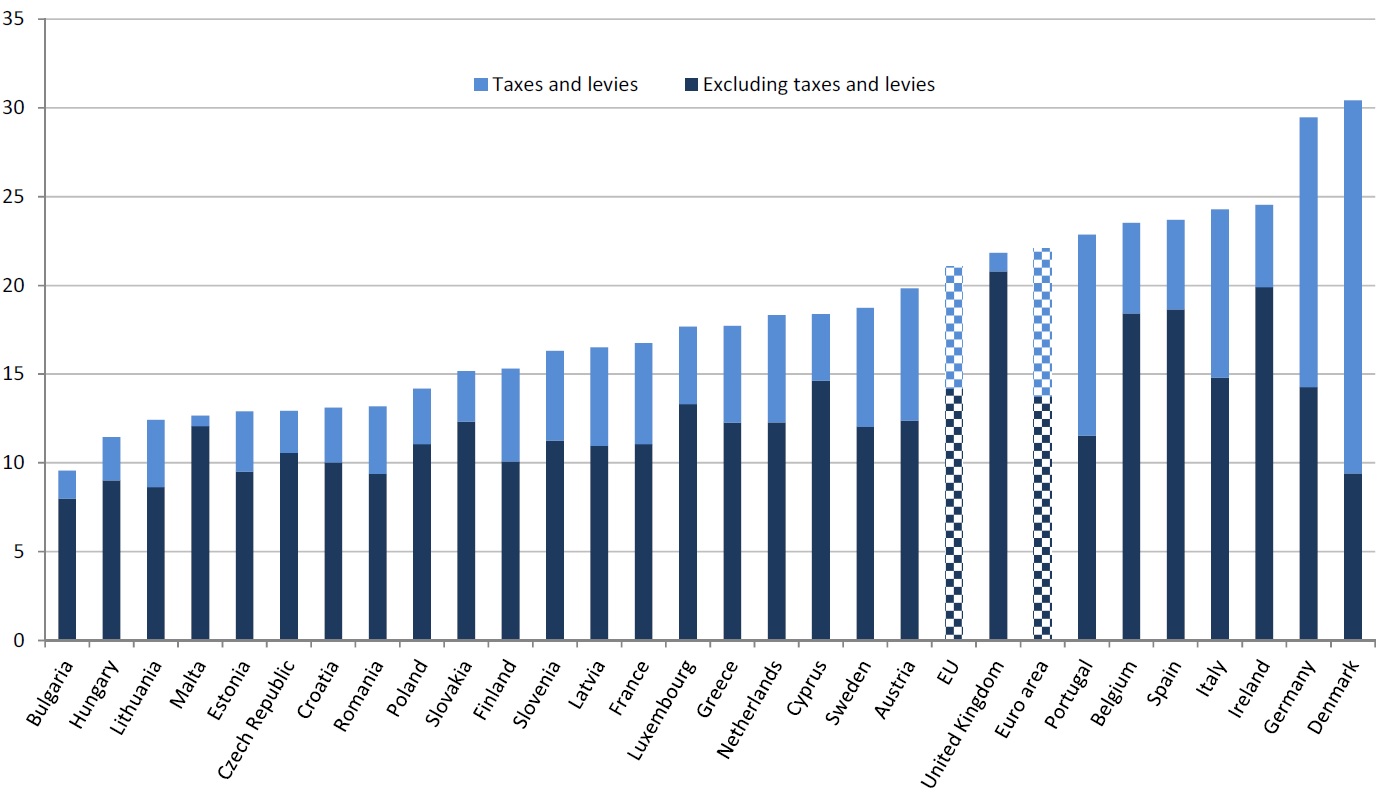
In addition to the IEA statistics, analysis by Eurostat of EU countries has found that electricity prices for households were also highest during the second half of 2015 in Denmark, Germany (Figure 2). The price of electricity for household consumers in Denmark was three times as high as the country with the lowest household electricity prices, Bulgaria[ii].
Figure 2: Electricity prices for household consumers, second half 2015 (¹) (EUR per kWh)
Source: EUROSTAT, 2015, “Energy prices in the EU in 2015”, 27th May 2016
Electricity prices in Denmark and Germany were predominantly impacted by the share of taxes and levies in the total household electricity price. Denmark had 69 per cent of their household electricity price made up of taxes and levies while in Germany it accounted for 52 per cent, both higher than the average in the EU were taxes accounted for a third of household electricity prices. Compare this to Malta and the Bulgaria where the taxes and levies accounted for less than 10 per cent[iii]. The taxes and levies cover the cost of green schemes.
What is the impact of renewable energy on these prices?
The price of energy depends on a range of different supply and demand conditions, including the geopolitical situation, network costs, environmental protection costs, severe weather conditions, and levels of excise and taxation.
It is likely that the high prices in Denmark and Germany are partly due to the two countries being renewable leaders in Europe.
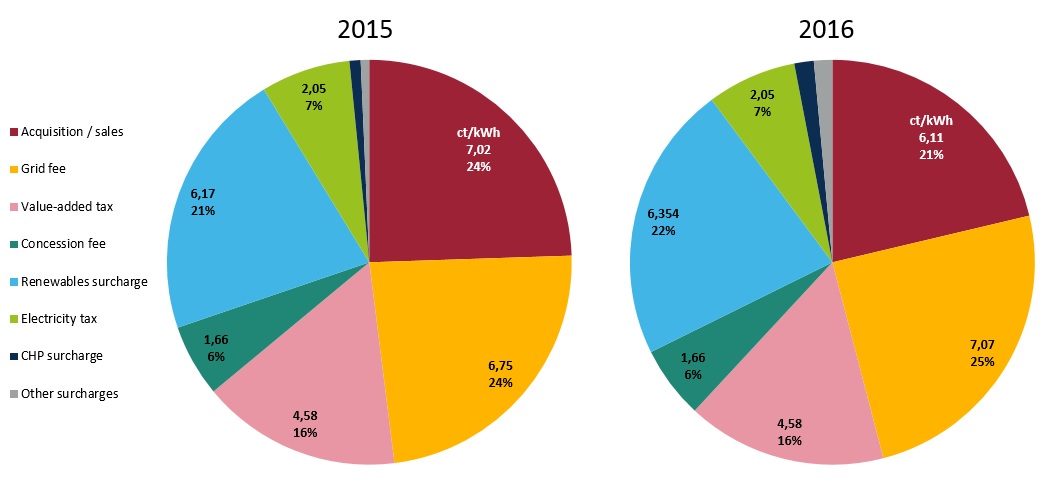
In Germany, more than half of the power price for households and small businesses consist of components determined by the state. In January 2016 on average, the renewable energy surcharge represented 22.2 per cent of household prices. The renewable energy surcharge pays the state-guaranteed price for renewable energy to producers and rose to 6.354 US cents/kWh in 2016. It is expected to rise to 6.88 US cents/kWh by next year. The only share that was larger was the grid charge which represented 24.6 per cent of the bill on average. This is a charge for the use of the power grids and is set by the federal grid regulator at 7.07 US cents/kWh. Figure 3 shows the composition of Germany’s power price for households[iv].
Figure 3: Germany’s composition of power price for households
Source: Clean Energy Wire, 2016, “What German households pay for power”
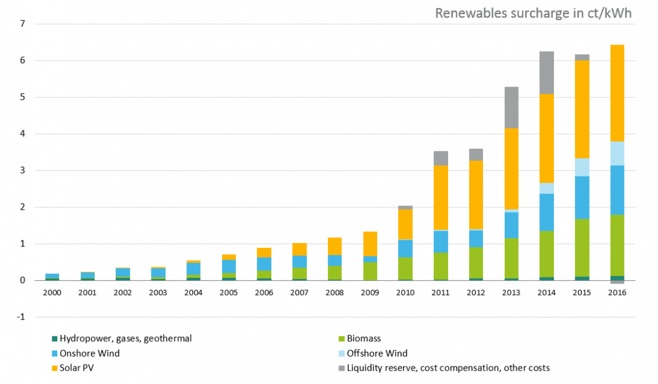
Solar PV installations received the largest share of feed-in tariffs payable on German power prices in 2015 followed by biomass plants and onshore wind turbines. Figure 4 highlights the renewable surcharge on power price by technology from 2000 to 2015[v].
Figure 4: Germany’s renewable surcharge on power price by technology
Source: Clean Energy Wire, 2016, “Bioenergy in Germany – facts and figures on development, support and investment”
Currently Denmark receives about 40 per cent its electricity from wind power and has a goal of getting half of its electricity from wind by 2020. One problem coming up against that goal is high energy prices. New calculations show that public subsidies paid by electricity consumers via the so-called Public Service Order (PSO) tax will increase further if plans are followed to establish a large number of wind turbines in coastal areas. Currently Danish consumers pay 25 ore/kWh (about AUD10c) in the PSO levy or a third more than the spot price for 1 kWh of electricity[vi].
How does Australia compare?
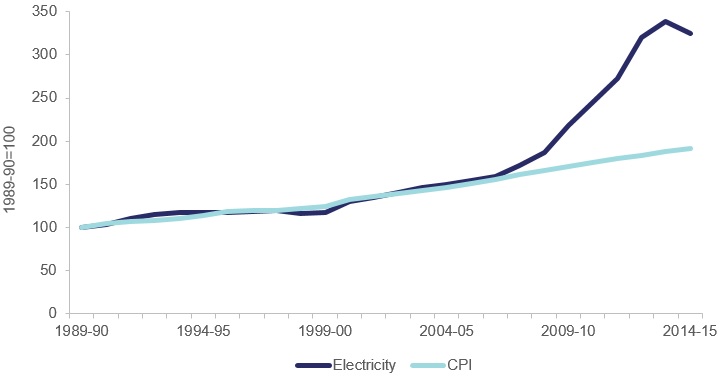
Over the 2004-2014 period, Australian retail electricity prices for households nearly doubled. Increases were largely caused by the need to invest in network infrastructure due to the need to replace aging assets. Residential electricity prices fell in 2014/15 following the abolishment of the Australian Government’s carbon tax.
Figure 5: Australian residential electricity price trend
Source: ABS energy statistics
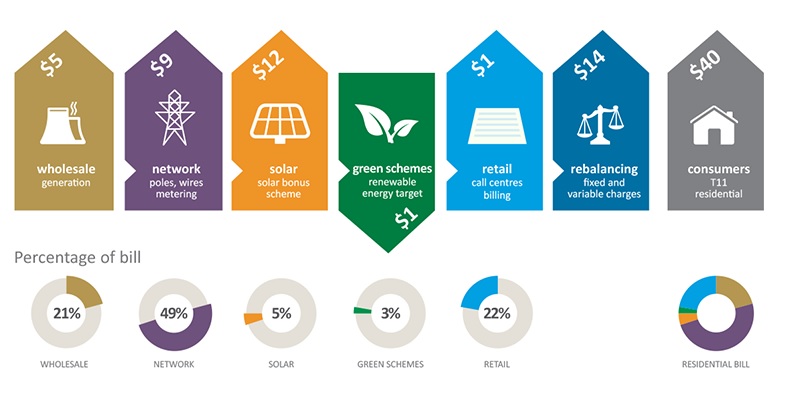
The cost of renewables currently represents a small share on the percentage of the energy bill. In most states network costs and generation costs form the largest components followed by the retail costs. As Figure 6 shows, Queensland renewable schemes account for less than 10 per cent of the total bill with network charges accounting for about 50 per cent of the typical residential customer's bill[vii]. Much like Queensland, South Australian and Victorian renewable schemes account for less than 10 per of the total bill[viii]. In Tasmania, a breakdown of the costs that make up Aurora Energy’s regulated tariff shows renewable energy certificates accounting for 5.6 per cent of the household bill[ix].
Figure 6: Breakdown of Queensland electricity residential bill
Source: Queensland Competition Authority, 2016, “Draft Decision: Residential electricity prices from 1 July 2015 for regional Queensland”
With the Queensland government committing to investigating a renewable energy target for Queensland of 50 per cent by 2030, it is unclear whether it will also have an upward impact on electricity prices much like it has in Germany and Denmark. This could also be the case for South Australia and Victoria who are proposing to increase their renewable share.
[i] International Energy Agency, “Key world energy statistics 2016”,
[ii] ibid
[iii] EUROSTAT, 2015, “Energy prices in the EU in 2015”, 27th May 2016
[iv] Clean Energy Wire, 2016, “What German households pay for power”, << https://www.cleanenergywire.org/factsheets/what-german-households-pay-power#dossier-references >>
[v] Clean Energy Wire, 2016, “Bioenergy in Germany – facts and figures on development, support and investment”, << https://www.cleanenergywire.org/factsheets/bioenergy-germany-facts-and-figures-development-support-and-investment >>
[vi] The Australian, 2016, “Danish consumers pay big and long to subsidise wind turbines”, << http://www.theaustralian.com.au/news/inquirer/danish-consumers-pay-big-and-long-to-subsidise-wind-turbines/news-story/f325bf64189961bfd2946e305d420e5e >>
[vii] Queensland Competition Authority, 2016, “Draft Decision: Residential electricity prices from 1 July 2015 for regional Queensland”, << http://www.qca.org.au/getattachment/dc4376a7-3475-469c-aff3-161e7a18b244/Electricity-draft-report-T11-residential.aspx >>
[viii] The Australian Energy Market Commission (AEMC), 2013, “2013 Residential Electricity Price Trends” – 13 December 2013
[ix] https://www.auroraenergy.com.au/your-home/bills-and-payments/your-bill-explained/electricity-cost-breakdown
Related Analysis
2025 Election: A tale of two campaigns
The election has been called and the campaigning has started in earnest. With both major parties proposing a markedly different path to deliver the energy transition and to reach net zero, we take a look at what sits beneath the big headlines and analyse how the current Labor Government is tracking towards its targets, and how a potential future Coalition Government might deliver on their commitments.
International Energy Summit: The State of the Global Energy Transition
Australian Energy Council CEO Louisa Kinnear and the Energy Networks Australia CEO and Chair, Dom van den Berg and John Cleland recently attended the International Electricity Summit. Held every 18 months, the Summit brings together leaders from across the globe to share updates on energy markets around the world and the opportunities and challenges being faced as the world collectively transitions to net zero. We take a look at what was discussed.
Great British Energy – The UK’s new state-owned energy company
Last week’s UK election saw the Labour Party return to government after 14 years in opposition. Their emphatic win – the largest majority in a quarter of a century - delivered a mandate to implement their party manifesto, including a promise to set up Great British Energy (GB Energy), a publicly-owned and independently-run energy company which aims to deliver cheaper energy bills and cleaner power. So what is GB Energy and how will it work? We take a closer look.
Send an email with your question or comment, and include your name and a short message and we'll get back to you shortly.


