

by Carol Tran
Electricity demand, in demand again?
After four years of reducing electricity consumption, Australia’s electricity demand grew in 2015 with Queensland and New South Wales the major mainland states contributing to the increase.
Between 2011 and 2014 energy consumption fell in Australia largely as a result of improvements in energy efficiency with new houses having better insulation and more energy efficient appliances. At the same time, there was strong growth in the installation of residential solar photovoltaics (PV). Solar PV installations grew from 1.372 million in 2011 to more than 4 million in 2014.[i]
Table 1 shows the percentage change in energy consumption by state and territory across Australia, as well as the total increase in power used. These figures are net of consumers’ use of their own distributed energy, such as rooftop PV. Queensland had the biggest jump in energy usage from 2011 to 2015, while energy consumption grew more slowly in NSW, Western Australia, and Tasmania in 2015. Electricity demand fell in Victoria, South Australia and the Northern Territory.
Table 1: Total Consumption GWh
|
% change |
NSW |
VIC |
QLD |
SA |
WA |
TAS |
NT |
Total |
|
2011 |
1.13% |
-0.04% |
-7.46% |
0.80% |
7.50% |
0.53% |
-0.33% |
-0.7% |
|
2012 |
-3.26% |
-0.87% |
0.36% |
-1.35% |
0.76% |
-3.40% |
0.09% |
-1.5% |
|
2013 |
-4.55% |
0.37% |
-0.91% |
0.20% |
2.26% |
0.22% |
3.70% |
-1.4% |
|
2014 |
-2.01% |
0.16% |
-0.23% |
-3.27% |
0.09% |
-1.35% |
-0.90% |
-1.0% |
|
2015 |
1.87% |
-6.14% |
9.90% |
-2.82% |
0.89% |
1.52% |
-1.55% |
1.4% |
Source: Australian Energy Council analysis, 2016
Identifying trends in energy demand is challenging, especially when trying to interpret a single year’s change. Year-on-year climate patterns can have an impact, for example, and mask the underlying trends. And 2015 was Australia’s fifth warmest year on record, while in February a hot spell led to records being set in large parts of the NT, Queensland, outback SA and northern NSW[ii]. Regardless, a few other general observations can be made on demand trends.
Industrial demand changes
The big changes on the prior year are the fall in Victoria and the increase in Queensland. Key contributors in each case are the changing fortunes of industrial producers. Queensland’s liquefied natural gas (LNG) industry has driven higher demand for electricity with three large LNG projects, Queensland Curtis LNG, Gladstone LNG, Australia Pacific LNG coming into operation. First export took place in December 2014.
In contrast because of the Point Henry smelter closure in 2014 and reduced production at the Portland aluminium smelter[iii], Victoria continued to see falling demand (table 1). The Portland aluminium smelter accounts for almost 10 per cent of Victoria's electricity demand.
The high Australian dollar over the past few years had a dampening effect on annual energy growth, with declining investment in manufacturing. There was also less investment in the construction sector. The high dollar had a negative impact on Australian exports, as Australian manufacturers increasingly sourced cheaper manufacturing from emerging Asian economies.
The Australian dollar has fallen 37 per cent from the record high of $US1.1081 it reached during the height of the mining boom in 2011[iv]. A lower Australian dollar is expected to help drive increased demand in non-mining industries like tourism, higher education, services and manufacturing, and help drive investment[v]. The lower dollar also supports exporters as the cost of production falls relative to the rest of the world. Manufacturing output thus looks to be improving, which will tend to increase electricity demand. Peter Burn, Australian Industry Group's head of policy, noted that "the lower dollar is clearly helping and, if it persists at this level or even falls a bit further as many are expecting, then that will also help domestic producers[vi].”.
Residential demand
Inevitably, population growth tends to lead to demand growth. But in recent years, changing consumer behaviour including more efficient appliances and new homes, a greater awareness of consumption due to price rises and the take up of solar hot water and rooftop PV, has led to lower consumption per household. This has often outweighed population growth.
Table 2 compares demand growth and population growth by state/territory. The overall picture is mixed with some states recording rises in residential demand and others falls even though all jurisdictions have had some growth.
Table 2: Changes in energy consumption and population growth in comparisons
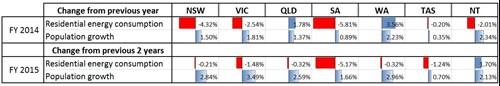
Source: EGA and ABS Demographic Statistics data [vii]
Population growth means greater economic activity overall, which is usally a driver of business demand for electricity. However in its 2016 National Electricity Forecasting Report, AEMO expects that despite population growth consumption across the NEM is expected to remain flat over the 20-year outlook period. It points to advancing energy technology and more consumers generating their own electricity from solar PV as key factors in this[viii]. Establishing a firm relationship between the two variables is tricky, though.
In Queensland, Energex has noted less engagement from Queenslanders over their electricity consumption. Figure 1 highlights that demand in households without solar installations dropped at a faster rate over the five year period to July 2014, before flattening out. Meanwhile, average consumption by solar households increased in 2014-15. Since June 2014, homes with solar have been consuming (on average) more electricity than non-solar households, reflecting the fact that those without solar PV have greater incentive to manage their electricity usage and power bills, while those with solar panels are less incentivised to be as energy efficient, including, according to Energex[ix] using their air conditioners “less responsibly”.
Figure 1: Average annual residential consumption in SE Queensland (kWh)
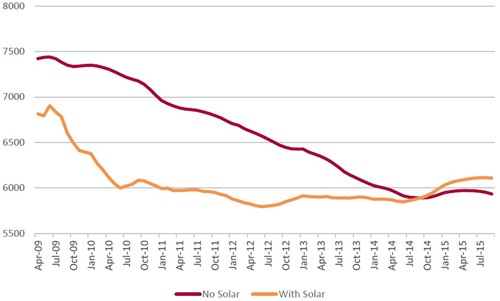
Source: Energex data, retrieved from Queensland Productivity Commission Report, 2016
[i] Clean Energy Australia Report 2015, Appendices, page 56.
[ii] Bureau of Meterology Annual climate statement 2015.
Related Analysis
2025 Election: A tale of two campaigns
The election has been called and the campaigning has started in earnest. With both major parties proposing a markedly different path to deliver the energy transition and to reach net zero, we take a look at what sits beneath the big headlines and analyse how the current Labor Government is tracking towards its targets, and how a potential future Coalition Government might deliver on their commitments.
Data Centres and Energy Demand – What’s Needed?
The growth in data centres brings with it increased energy demands and as a result the use of power has become the number one issue for their operators globally. Australia is seen as a country that will continue to see growth in data centres and Morgan Stanley Research has taken a detailed look at both the anticipated growth in data centres in Australia and what it might mean for our grid. We take a closer look.
Transmission Access Reform: Has the time passed?
Last week submissions to the AEMC’s Transmission Access Reform consultation paper closed. It is the latest in a long running consideration of how best to ensure both efficient dispatch and investment in new generation to ensure new kit is sited in the best locations. But this continued pursuit of reform brings to the fore the question of whether other policy initiatives have already superseded the need for the proposed changes. We take a look at where the reform proposals have come from, as well as concerns about the suggested approach that have emerged.
Send an email with your question or comment, and include your name and a short message and we'll get back to you shortly.