

by Carl Kitchen
Countdown: Coal racing the clock
Last week the UK reported that it had run its grid for 90 hours and 45 minutes (or more than three and a half days) without any electricity from coal-fired generation. It is the longest period that the UK grid has operated without coal in the generation mix - in 2012 coal had met more than 40 per cent of the UK’s electricity needs.
Thomas Edison opened the UK’s first coal power station at Holborn, London, in 1882, but 135 years on the signs emerged that it had hit a tipping point in the decline of coal-fired generation[i]. It was reported that on 21 April 2017 no coal sourced electricity was generated for a 24-hour period. Since then the amount of time that UK homes, business and industry have not been powered by coal plants has continued to grow as more renewables and gas have come into the grid and coal plants have retired.
This drop in coal-fired generation has been most recently driven by a UK Government initiative to have all coal plants closed by 2025 – today there are seven still in operation. Figure 1 below shows the operational plants as well as the coal plants that have closed or been converted to biomass since the Large Combustion Plant Directive (LCPD). The LCPD was a European Union directive issued in October 2001 which required EU member states to legislate to limit flue gas emissions from combustion plant that was 50MW or bigger.
Figure 1: UK Coal Plants
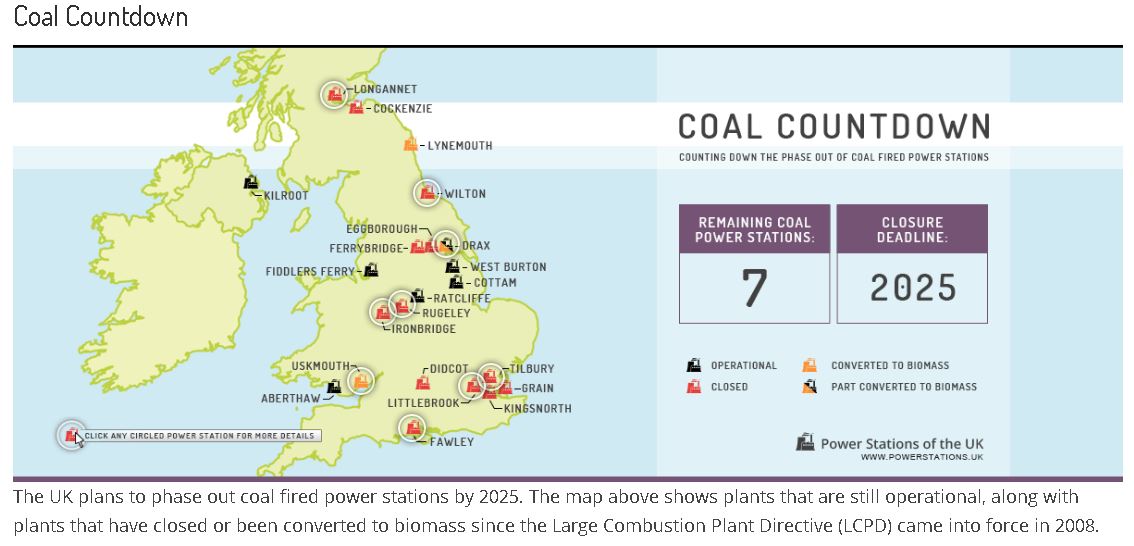 Source: Power Stations of the UK
The directive had a 2007 deadline for plants that did not comply with the strict emission limits to opt-out, whereby they could operate for a further 20,000 hours until 2015 when they had to close.
For the UK power sector, the government also introduced a Carbon Price Support (CPS) in 2013 to supplement the European carbon price (which is currently hovering around 20 Euros or AUD 32). The CPS required UK power generators to pay a minimum carbon price, which is referred to as the Carbon Price Floor (CPF). In 2015 the CPF went from GBP 9.55 per tonne of carbon to GBP 18.08 (AUD 33) and it was subsequently frozen at this amount till 2021[ii]. As a result of the higher CPF many of the UK’s coal plants became uneconomic to operate[iii].
With its latest record period without coal-fired generation, 42 per cent of electricity came from gas power stations, 23 per cent from nuclear, 12 per cent from wind, 11 per cent solar, 4 per cent biomass and 1 per cent from large hydro. The more than three and a half day period came after the UK’s National Grid reported earlier that in the first quarter of 2019 the UK’s grid operated for 650 hours without coal-fired generation.
Not Alone
The UK is not alone in seeing the amount of coal generation falling. The IEA has reports that for the first time, gas-fired generation overtook coal as the major source of electricity in the OECD in 2018.
Figure 2: Generation from coal and gas, OECD
 Source: IEA. All Rights Reserved.
Gas power plants accounted for 27.4 per cent of electricity generated versus 25.4 per cent for coal. Renewables account for another 27.4 per cent of generation (with hydro, 13.8 per cent, leading the way). Nuclear represented 17.5 per cent of the generation mix. The change in generation by source can be seen in figure 3.
Figure 3: Change in electricity generation 2017-2018, OECD
 Source: IEA. All Rights Reserved
The share of coal continued the decrease that started in 2014, falling to 2,710 TWh. OECD net electricity production overall grew by 1.9 per cent (+195.2 TWh), reaching 10,682 TWh driven primarily by natural gas, which increased by 156.4 TWh ( up 5.6 per cent), to 2,928 TWh. Overall, fossil fuels generated an additional 41.4 TWh compared to 2017.
Generation from gas plants has grown strongly in the US, which reflects the increased availability of the fuel as a result of the development of shale gas as well as increased capacity, particularly combined cycle gas turbine plants. The US Energy Information Administration notes the amount of combined cycle gas turbine power plant capacity has been steadily growing and in 2018 surpassed coal-fired plants in over capacity. There were 264GW of CCGT plant and 243GW of coal-fired generators. CCGT plants account for about half of all gas generation in the US but last year provided nearly 90 per cent of all gas-fired electricity to the grid[iv].
Figure 4: Annual US Electricity Generating Capacity 2002-208

Source: US Energy Information Administration
In Europe, meanwhile renewable generation is growing quickly on the back of policy measures to decarbonise.
OECD net electricity production grew by 1.9 per cent (up 195.2 TWh), reaching 10,682 TWh driven primarily by natural gas, which increased by 156.4 TWh (5.6 per cent higher than the previous year), up to 2,928 TWh. The share of coal continued the decrease that started in 2014, but overall, fossil fuels generated an additional 41.4 TWh compared to 2017.
All sources of renewable generation increased in the OECD during 2018. The largest increases for renewable technologies were wind (up 51.9 TWh, or 7.5 per cent) and solar (up 51.8 TWh, or18.9 per cent).
Coal
The use of coal for power generation is decreasing in most OECD countries, with a total decrease in the OECD of 104.6 TWh in 2018 compared to 2017 ( down 3.7 per cent or 2,710 TWh).
The biggest falls were in the US ( down 62.5 TWh, or 5 per cent), Japan (down 12.7 TWh, or 3.7 per cent), Germany (down 11.6 TWh, or 5 per cent) as well as the UK. In contrast, Turkey increased its coal fired generation (up 15.2 TWh, or 16.5 per cent) – a switch from gas to coal that goes against the more common trend of coal-to-gas.
Gas
Out of all sources of power generation, natural gas increased the most, up by 156.4 TWh (5.6 per cent), to 2,928 TWh in 2018. The US added 188.9 TWh of additional gas-fired generation; followed by Korea (up 34.3 TWh, or 28.7 per cent). In total 21 of the 35 OECD countries, including Australia (where gas generation was down 11.1TWh or 20 per cent) actually decreased gas use for power generation.
Solar
Solar saw the highest relative increase in 2018 compared to 2017 out of all electricity sources, increasing from 274.0 TWh to 325.8 TWh, an 18.9 per cent increase. The US led the way (up 18.2 TWh, or 25.2 per cent), Japan (12.9 TWh, or 21.8 per cent higher) and Germany ( up 6.9 TWh, or 17.4 per cent). Most OECD countries had double digit growth rates, showing the strong push in some countries in favor of this technology, according to the IEA.
Wind
In 2018, wind generation supplied 744.6 TWh, 7.5 per cent up on the prior year, led by the US (up 20.6 TWh to 274.8 TWh), Germany (114.1 TWh, up 7.9TWh), and the UK (56.6 TWh, up 7TWh).
[i] http://www.powerstations.uk/
[ii] Carbon Price Floor (CPF) and the price support mechanism, Briefing paper, House of Commons, 8 January 2018
[iii] Power Stations of the UK
[iv] US national gas-fired combined-cycle capacity surpasses coal-fired capacity, Today In Energy, 10 April 2019, US Energy Information Administration
Related Analysis
Integrated System Plan – What Should We Expect?
The release of an expert study of last year’s autumn wind drought in Australia by consultancy Global Power Energy[i] this week raised some questions about the approach used by the Australian Energy Market Operator’s in its 2024 Integrated System Plan (ISP). The ISP has been subject to debate before. For example, there has previously been criticism that some of the ISP’s modelling assumes what amounts to “perfect foresight” of wind and solar output and demand[ii], rather than a series of inputs and assumptions. The ISP is produced every two years and with the draft of the next ISP (2026) due for release soon, it is useful to consider what it is and what it is not, along with what the ISP seeks to do.
The ‘f’ word that’s critical to ensuring a successful global energy transition
You might not be aware but there’s a new ‘f’ word being floated in the energy industry. Ok, maybe it’s not that new, but it is becoming increasingly important as the world transitions to a low emissions energy system. That word is flexibility. The concept of flexibility came up time and time again at the recent International Electricity Summit held in in Sendai, Japan, which considered how the energy transition is being navigated globally. Read more
The energy transition and power bills: Why aren’t they cheaper?
With energy prices increasing for households and businesses there is the question: why aren’t we seeing lower bills given the promise of cheaper energy with increasing amounts of renewables in the grid. A recent working paper published by Griffith University’s Centre for Applied Energy Economics & Policy Research has tested the proposition of whether a renewables grid is cheaper than a counterfactual grid that has only coal and gas as new entrants. It provides good insights into the dynamics that have been at play.
Send an email with your question or comment, and include your name and a short message and we'll get back to you shortly.