

by Panos Priftakis
Peak to average demand: What does it tell us?
South Australia, Victoria and New South Wales have continued to show the greatest variation in peak to average demand ratios in the National Electricity Market (NEM).
During 2015-16, the peak to average demand ratios showed a marked increase in Victoria and New South Wales, when compared to the previous year, with the ratios approaching their historic high points. South Australia also experienced an increase in its peak to average demand ratio in 2015-16.
The ratios recorded for Tasmania and Queensland remained reasonably consistent with previous years. Both states tend to have more consistent weather patterns compared to other regions in the NEM and while Queensland has recorded the strongest growth in average demand in the NEM with LNG projects coming on line, it has also recorded increased peak demand and, in fact, set a new high point for peak demand (9,332 MW) in 2017[i].
With the closure of coal fired power stations in South Australia and the expected in closure in Victoria the Australian Energy Market Operator (AEMO) has assessed the SA and Victorian market and advised there is sufficient generation to meet maximum demand. The increased use of renewable energy will require careful planning to ensure that these risks are managed so we can continue to decarbonise supply whilst maintaining reliability.
Peak to average demand: a useful indicator
The peak-to-average demand ratio is a measure how much higher annual peak demand is compared to annual average. A high ratio can result from a spike in the peak demand levels, or from average demand flattening, or declining. A higher ratio can affect everything from electricity prices to energy availability.
The ratio is an indicator of how much electricity demand can fluctuate in a given period, and it can also help highlight where potential stress is being placed on the electricity system. Continuous fluctuations in the ratio make it more challenging to plan and manage the energy system, while a bigger gap between peak and average demand will place additional stress on grid. A high peak demand ratio indicates that more peaking plant is likely to be required compared to baseload. As the former is more expensive on a unit cost basis (as it is not running consistently), other things being equal a high peak demand ratio is likely to result in higher average prices.
Electricity networks are built to be able to accommodate the projected peak demand levels at the different locations around their networks. Accordingly peak demand is a driver of network costs. Network revenues are still collected (from small customers at least) on a volume basis. So a high and growing ratio is a sign of which regions can expect to see upward pressure on network unit charges.
High peak to average demand ratios can also signal decreasing average utilisation levels for generators and may require development of additional peak generation capacity.
Key factors that can contribute to shifts in the peak to average demand ratios include increasing use of household appliances, such as air conditioners (which lift peak demand levels in summer), increasing energy efficiency (particularly new appliances and other household items like low consumption lightbulbs), which reduces average demand, the uptake of technology, like solar PV, as well as a shift away from more intensive industrial loads as a result of structural changes in the economy, all of which can push down average demand. Different weather patterns and energy demand patterns regionally can result in substantially different peak to average demand ratios across the NEM.
Figure 1: Ratio of peak demand to average demand in the NEM
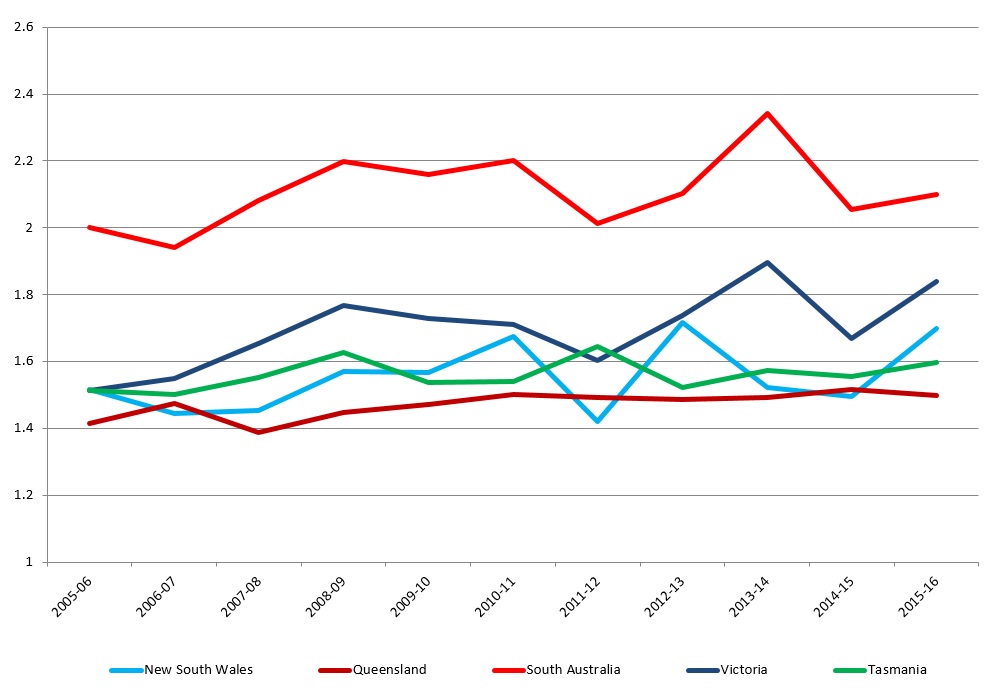
Source: NEM-Review, AER
Figure 1 shows the ratios across the NEM in the period 2005-04 and 2015-16. South Australia, Victoria and NSW have shown the biggest differences in peak to average demand since the creation of the NEM at the end of 1998, with South Australia reaching a ratio of two or greater for six of the past seven years.
While average demand fell steadily from 2010-11 in South Australia and between 2008-09 and 2013-14 in NSW, 2015-16 saw average demand grow in SA for the first time in five years and continue its gradual growth since 2013-14 in NSW. While declining since 2007-08, average demand in Victoria has flattened out in the past two years (2014-15-2015-16) and peak demand increased during 2015-16.
Weather played a part. Victoria experiencing hot weather at the end of 2015 and in the first half of 2016. The state was also affected by a prolonged heatwave in March 2016.
Meanwhile, the first six months of 2016 were the warmest on record for NSW, according to the Bureau of Meteorology, with a record warm autumn and a significant heatwave in March. In New South Wales, the area-averaged daily maximum temperature was above 35 °C on each of the nine days from 1 to 9 March (in comparison, in Victoria it exceeded 32 °C on each of those nine days)[ii]. South Australia reached 40 degrees for a record seven days in December 2015.
Average demand and peak demand across Victoria, South Australia and New South Wales are shown in figures 2-5. Although average demand has kicked up over the past year, it still remains much lower than a decade ago, which is the result of a combination of the increase in rooftop solar PV and reduced demand from large industrial facilities, some of which have closed or reduced demand.
Figure 2: Average Demand in Victoria
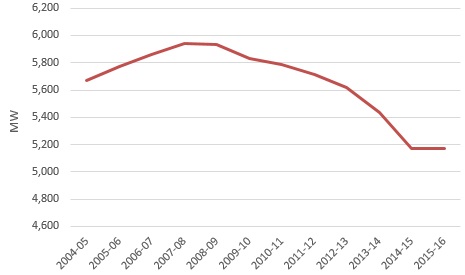
Source: NEM Review
Figure 3: Average Demand in South Australia
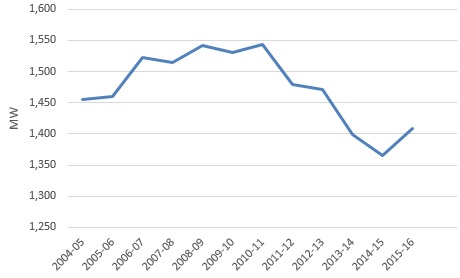
Source: NEM Review
Figure 4: Average Demand in NSW
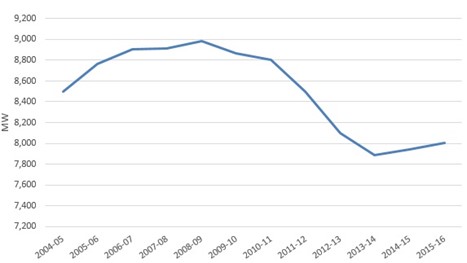
Source: NEM Review
Many of the highest peak demand events have occurred five or more years ago again largely due to these factors, with the exception being Queensland which has been offset by growing demand, particularly in compressing LNG for export. In 2017 Queensland reached the all-time peak of 9,332 megawatts (MW) which was reached on Wednesday afternoon the 18th of January. The peak-demand ratio in Queensland however has not been greatly affected as the average demand has increased with the record peak demand.
Figure 5: Peak demand by NEM states, 1998-2016
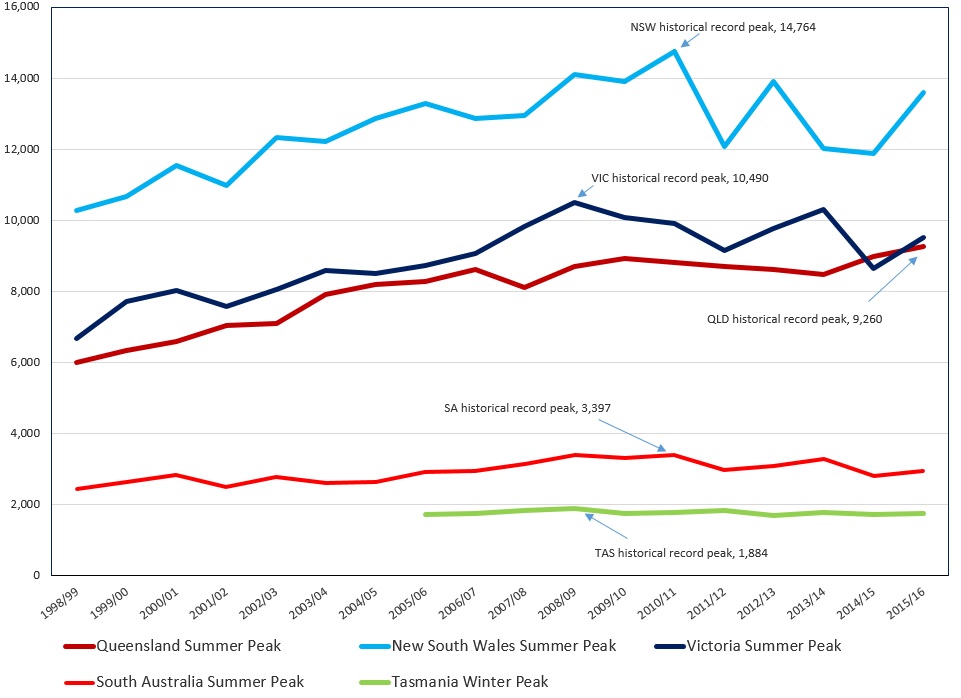
Source: AER, 2017
Each jurisdiction faces different challenges, which include extreme weather events, natural disasters, isolated customers and different topographies for distributors to contend with. As highlighted above, demand is highly dependent on weather and occurs during the summer for all regions except for Tasmania where peak occurs during winter [where homes tend to use electrical heating). NSW can change depending on any extremes during the two seasons.
If average demand falls, peak demand does not need to reach historical highs to lead to high peak to average ratios. South Australia and Victoria achieved their highest ratios in 2013-14 when several days of extreme heat led to demand levels just short of the records, while New South Wales achieved its highest ratio in 2012-13. The highest annual peak regional demand for South Australia and NSW occurred in 2010-11, while in Victoria the highest record peak demand occurred in 2008-09, when an “exceptional” heatwave impacted the state in the last week of January and stretched into February. It was accompanied by numerous all-time record maximum temperatures on 7 February 2009[iii].
Across Australia, there is considerable fluctuation in the peak loads placed on electricity networks, as opposed to the average load, with considerably increased demand in extreme heat. Differences in climate, housing, economics, population, and several other factors vary drastically in different regions of the Australia, so electricity consumption patterns are not the same in every region. The higher ratio translates into decreasing average utilization levels for generators with networks maintaining a sufficient capacity to meet expected peak loads and reserve margins. It is therefore important that utilities and system operators can prevent system failures if the peak demand spikes much higher than the year’s average.
What is the impact of recent and announced power stations closing?
In May last year the 544MW Northern Power Station closed in South Australia, the last remaining coal-fired generator in that state, while in 2017 the 1,600MW Hazelwood power station will close in Victoria. The Australian Energy Market Operator (AEMO) has assessed the market in South Australia and Victoria and has advised there is sufficient generation to meet maximum demand.
The closure of these power stations has increased the cost of wholesale electricity, as there is reduced supply to meet the same demand. This has flowed through to higher power prices in South Australia and Victoria.
What is the impact of increased renewable energy when peak demand is reached in summer?
As discussed earlier, rooftop solar PV contributes to the supply of electricity on hot days. In practice, the market operator records the solar PV as a reduction in demand. As a result we are now seeing peak demand tending to occur later in the day as solar generation drops off. This means that further uptake of rooftop PV is unlikely to impact peak demand much more. Wind generators’ contribution to the generation supply during heatwaves is dependent on the amount of wind blowing. The hottest days in Australia are often still days.
South Australia has the highest penetration of intermittent renewable generation in an isolated grid in the world. Around 40 per cent of that state’s generation comes from wind energy. What this means during a heatwave is that this generation is only available if the wind is blowing. While there is technically sufficient capacity to meet demand in South Australia even if there is no wind blowing during a heatwave, the grid is increasingly vulnerable during these conditions.
Increased use of renewable energy will require careful planning to ensure that these risks are managed so we can continue to decarbonise supply whilst maintaining reliability.
[i] http://www.brisbanetimes.com.au/queensland/brisbane-weather-record-numbers-crank-air-conditioning-20170118-gtu71y.html
[ii] http://www.bom.gov.au/climate/current/statements/scs55.pdf
[iii] http://www.bom.gov.au/climate/current/season/vic/archive/200902.summary.shtml
Related Analysis
Retail protection reviews – A view from the frontline
The Australian Energy Regulator (AER) and the Essential Services Commission (ESC) have released separate papers to review and consult on changes to their respective regulation around payment difficulty. Many elements of the proposed changes focus on the interactions between an energy retailer’s call-centre and their hardship customers, we visited one of these call centres to understand how these frameworks are implemented in practice. Drawing on this experience, we take a look at the reviews that are underway.
Data Centres and Energy Demand – What’s Needed?
The growth in data centres brings with it increased energy demands and as a result the use of power has become the number one issue for their operators globally. Australia is seen as a country that will continue to see growth in data centres and Morgan Stanley Research has taken a detailed look at both the anticipated growth in data centres in Australia and what it might mean for our grid. We take a closer look.
Green certification key to Government’s climate ambitions
The energy transition is creating surging corporate demand, both domestically and internationally, for renewable electricity. But with growing scrutiny towards greenwashing, it is critical all green electricity claims are verifiable and credible. The Federal Government has designed a policy to perform this function but in recent months the timing of its implementation has come under some doubt. We take a closer look.
Send an email with your question or comment, and include your name and a short message and we'll get back to you shortly.