

by Carl Kitchen
Challenges of a dynamic energy market
The challenge facing both government and energy businesses in managing electricity prices is again illustrated by the recent release of AEMO’s latest quarterly energy dynamics[i] data. The energy dynamics reports provide good insight into factors that can impact price outlooks as well as details of shifts underway in the National Electricity Market.
The latest incarnation shows that wholesale prices have fallen in Victoria, South Australia and Tasmania (by $1, $8 and $34 respectively) compared to the second quarter this year (while rising slightly in Queensland and New South Wales $7 and $3 respectively), which can be seen in figure 1 below).
Average wholesale prices were lower in all regions than in the corresponding period last year, with the two largest decreases in Vic and SA, with prices falling $19/MWh and $8/MWh respectively. The overall shift in prices since the beginning of 2017 is shown below.
Figure 1: Average wholesale prices NEM Q1 2017-Q3 2018[ii]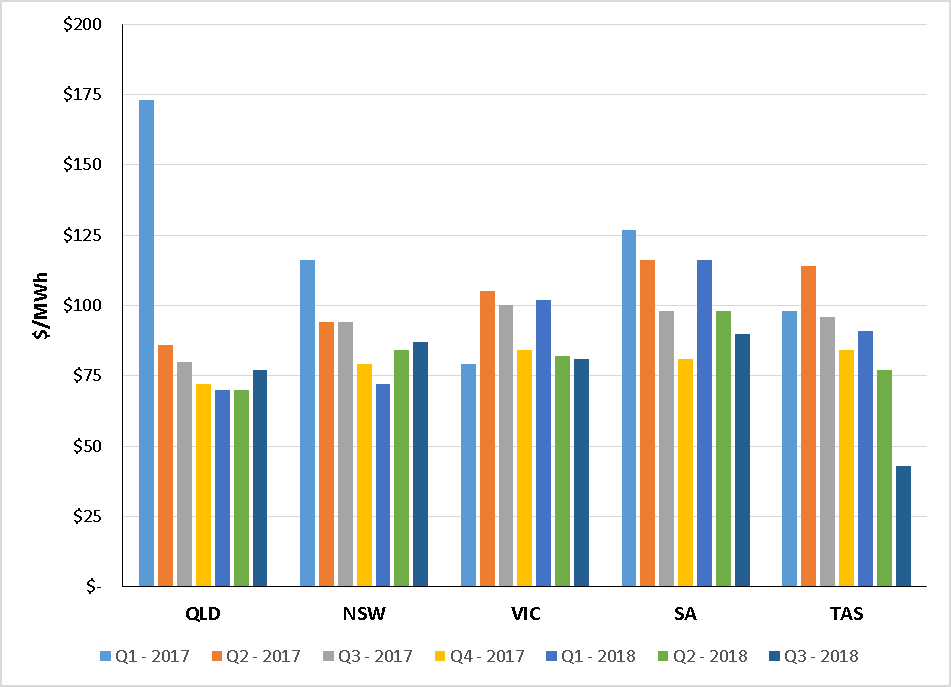 Source: AEMO Quarterly Energy Dynamics reports, 2018
The report also flags that the price of electricity futures “rebounded strongly” from the falls in the first half of the year. The increases occurred across calendar year 2019 and 2020 swap products, with the biggest rise for 2019 occurring in NSW (14 per cent) and Victoria (13 per cent), which is shown in the table below right.
Figure 2: ASX energy –Calendar year 2019 swap prices by region. Table 1: Change over Q3 2018 for Cal 2019 and Cal 2020 swap prices 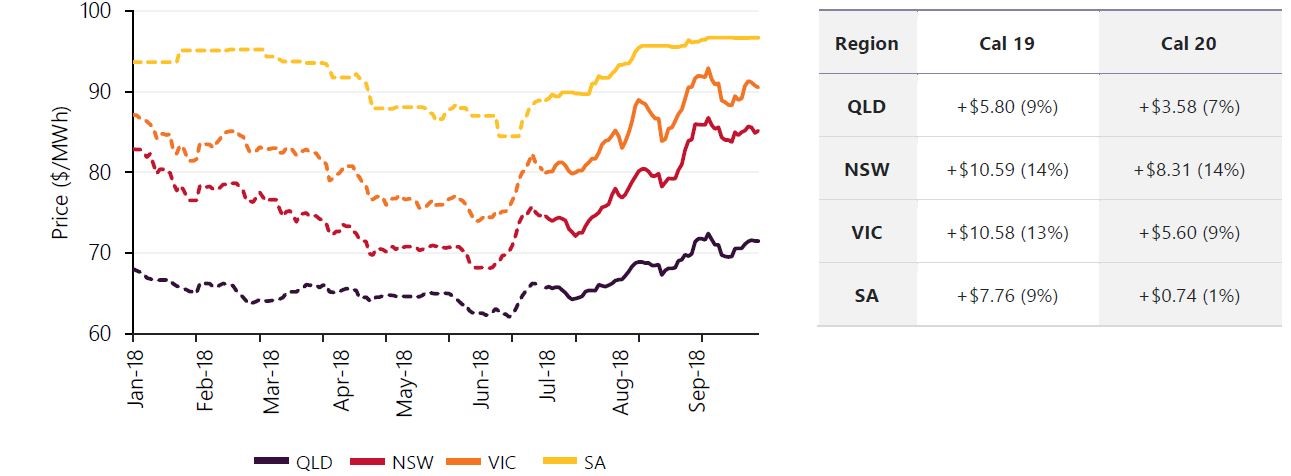 Source: AEMO Quarterly Energy Dynamics Q3 2018 report, 2018
Below we take a look at the factors behind the current wholesale prices and changes impacting the future markets.
Wholesale Electricity Prices
The trend in average wholesale prices since the beginning of 2017 is shown in Figure 2.
For the third quarter this year, factors behind the wholesale price rises in Queensland and NSW in the third quarter this year (shown in figure 2 above) were reduced availability of black coal-fired power stations with average generation falling to its lowest level since the fourth quarter of 2016. This was due to a comparatively higher level of outages in NSW (see figure 3) and periods of lower spot prices in Queensland leading to lower output from price-sensitive generators.
Figure 3: Coal average availability and generation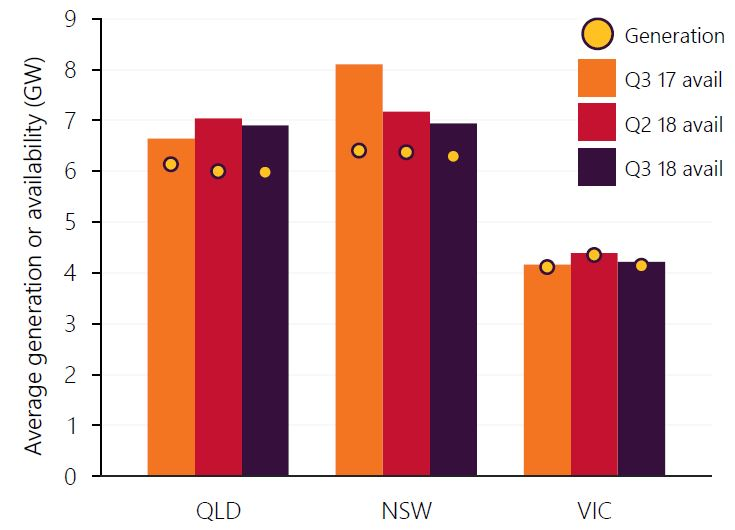
Source: AEMO Quarterly Energy Dynamics Q3 2018 report, 2018
AEMO notes that the NSW coal-fired fleet recorded its lowest availability since Q2 2016. There were extended outages at the Bayswater and Vales Point power stations, but also comments that while there was a drop of 1160MW in availability of NSW coal-fired electricity there was only a 110MW fall in the actual output as the remaining online plant ran comparatively harder.
There was also a shift in Queensland gas-fired generation into higher priced bands as well as reduced availability. This coincided with higher Queensland gas prices and it notes that the Brisbane STTM recorded its second highest price on record (up 41 per cent compared to the same quarter last year).
Average wholesale prices were lower in all regions compared to the same period last year with the biggest falls in Victoria (down $19/MWh) and SA (-$8/MWh) which were the result of temporary factors such as higher hydro output, as well as more permanent factors with new large-scale solar and wind coming online.
Average rooftop PV generation increased from 713MW to 875MW compared to Q3 2017 with the largest increase in SA and Victoria (up 32 per cent). Across the NEM average daily peak generation from small-scale PV increased 21 per cent compared to the corresponding period last year (see Figure 4).
Figure 4: Average daily small scale solar generation profile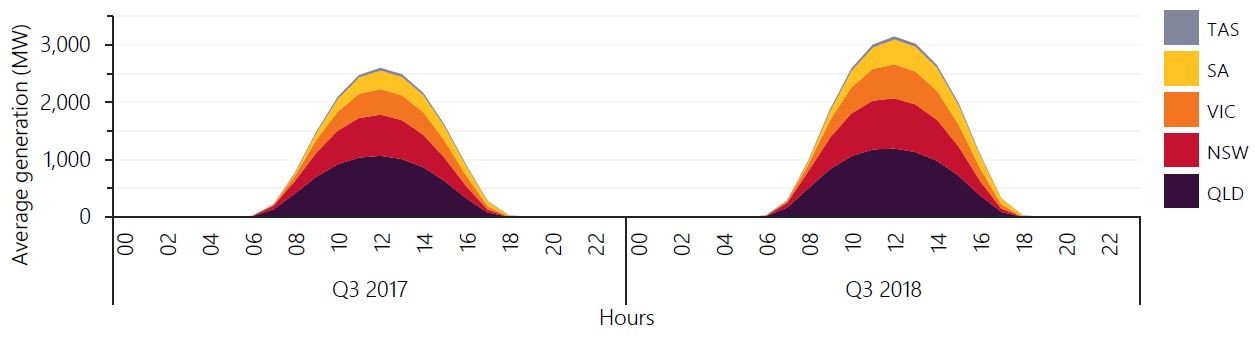
Source: AEMO Quarterly Energy Dynamics Q3 2018 report, 2018
There was record wind output, as well as increased imports to Victoria from Tasmania with record hydro generation in that state and Basslink returning to service for the entire quarter. Basslink flows into Victoria were at near record levels (net 382MW on average). The third quarter had the third highest hydro generation output since the NEM started (average output of 2387MW, 26 per cent higher than last year for the same period) with the largest increase in Tasmania which recorded its highest quarterly hydro output since joining the NEM in 2005. Above average rainfall in recent months resulted in some storage being close to capacity (see figure 5).
Figure 5: Hydro Tasmania Total Storage Levels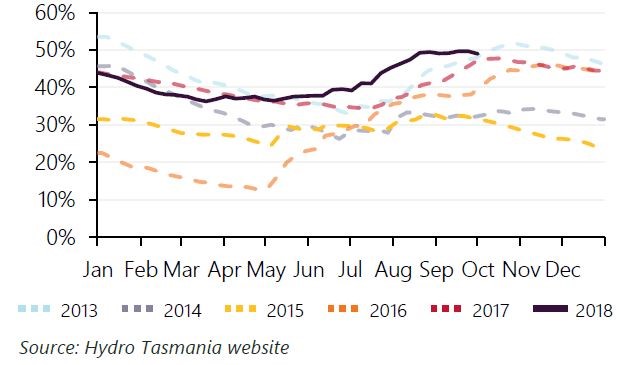
Source: AEMO Quarterly Energy Dynamics Q3 2018 report, 2018
The high storage levels contributed to Hydro Tasmania reducing the price of its energy offers and the increase in relatively low-priced generation led to significant flows to Victoria via Basslink and much lower Tasmanian wholesale prices.
In South Australia the above factors were offset by increased price volatility over Q3, with most volatility during network outages in July, which restricted flows on the Heywood interconnector.
Electricity Futures Markets
As noted the price of electricity futures traded on the ASX rebounded. The price increases coincided with a reduction in the hydro storage levels on the mainland as a result of drier conditions and Snowy Hydro’s comparatively high output year-to-date, with the potential to limit Snowy Hydro’s output in 2019.
Figure 6: Snowy Hydro – Lake Eucumbene Storage Level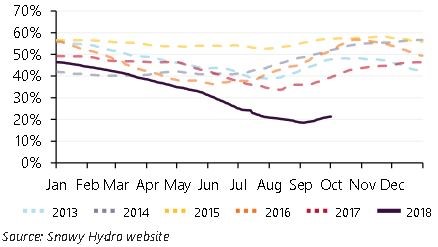
Source: AEMO Quarterly Energy Dynamics Q3 2018 report, 2018
Other factors pointed to in the report are:
- The relatively high wholesale gas prices coupled with some expectations this will continue into 2019.
- Concerns over the speed of connecting new renewable projects to the grid, which could slow deployment
- Weather forecasts for hot and dry conditions for the start of 2019, which could intensify high demand periods over the summer peak.
First quarter 2019 cap prices were up by 31 per cent in Victoria, 25 per cent in NSW and 13 per cent in South Australia reflecting market sentiment about price volatility over summer. This is illustrated by first quarter 2019 cap prices at the end of the third quarter this year were trading at higher price than the first quarter prices this year in the lead up to last summer.
Coal prices heat up
The report also highlights the higher price of coal. The AEMO report points to increasing international coal prices with the average spot price for high quality Australian Newcastle thermal coal up 15 per cent from the previous quarter. The price reached $160 per tonne which is its highest level since early 2011. This continues a longer-term trend with average quarterly prices up 50 per cent since the beginning of last year and 130 per cent since the beginning of 2016.
The reports notes that while high international coal prices “did not appear to directly affect operation of the majority of Australia’s coal-fired fleet over Q3, 2018 continued high prices over the short to medium term have the potential to affect generation costs into the future”.
It also warns that while most of Australia’s coal-fired power stations remain on legacy contracts, any need for additional coal will be “potentially difficult” to obtain due to rail congestion. “High spot prices typically result in increased export volumes out of the Newcastle coal export terminals and an increase in the utilisation of the Hunter Valley rail network that connects coal mines with the terminal. Any black coal generator that relies on the Hunter Valley rail network for delivery of incremental coal will be doing so on a more constrained network”.
Figure 7: Quarterly average international black coal spot, futures and contract prices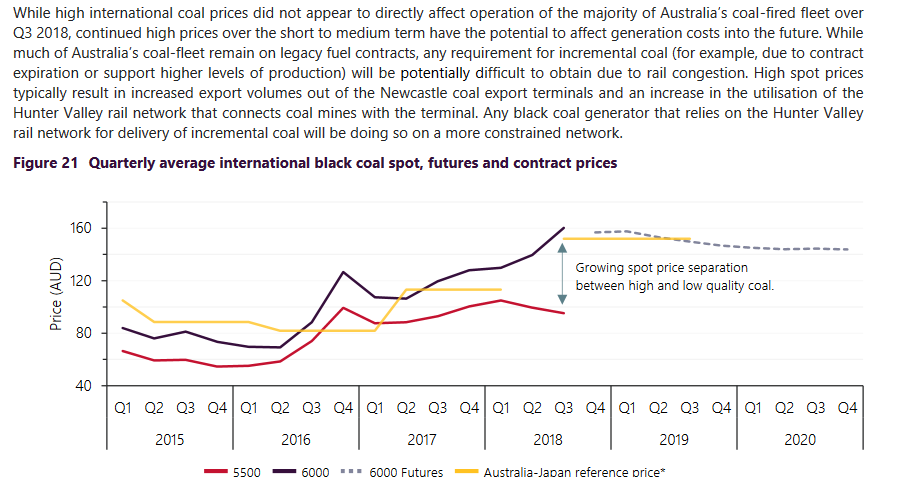
Source: AEMO Quarterly Energy Dynamics Q3 2018 report, 2018
Source for Newcastle thermal spot and future prices: Bloomberg. * Aust-Japan reference price refers to 12 month contract price between Glencore and TEPCO
The Energy Council notes than when generators are having difficulty procuring additional fuel supply, they need to operate cautiously to ensure they don’t run down their stockpiles and create a more severe shortage down the track. This means the opportunity value of their fuel has increased, and they will need to reflect this in their market bids. This is how the market is supposed to work: they need to consider how much the fuel is worth to them now, not what it was when they may have entered contracts years ago.
FCAS Costs and High Priced Event
The quarterly report also highlights the Queensland and South Australian system separation on 25 August 2018 when the NSW-Queensland interconnector tripped which separated Queensland from the rest of the NEM. This led to separation of SA when the Heywood Emergency Control Scheme was activated. There was also 1110MW of under-frequency load shedding in NSW, Victoria and Tasmania.
One consequence was that all mainland regions recorded FCAS prices at the price cap of $14,500/MWh. Following the event the QNI was added to AEMO’s vulnerable transmission list.
Overall, FCAS costs were the highest in a quarter since 2008 and reached $73 million. The increase in costs were despite a 17 per cent reduction in FCAS demand compared to the previous quarter. A major contributor to the increase was more than $10 million in FCAS costs accumulated due to the trip on the QNI interconnector and separation of Queensland and South Australia from the rest of the NEM. During this period AEMO required provision of local FCAS in Queensland and SA and due to the limited local FCAS providers on this day, very high prices and costs occurred in all NEM regions and particularly Queensland.
Another factor was reduced hydro supply for FCAS as hydro generators such as Hydro Tasmania made offers to optimise energy dispatch rather than FCAS dispatches.
[i] https://www.aemo.com.au/-/media/Files/Media_Centre/2018/QED-Q3-2018.pdf
[ii] The high average wholesale price in Queensland in Q1 2017 reflects heatwave conditions in the early part of the year and a number of high price events. The much lower price in Tasmania in Q3 2018 is discussed further in the body of the text.
Related Analysis
Climate and energy: What do the next three years hold?
With Labor being returned to Government for a second term, this time with an increased majority, the next three years will represent a litmus test for how Australia is tracking to meet its signature 2030 targets of 43 per cent emissions reduction and 82 per cent renewable generation, and not to mention, the looming 2035 target. With significant obstacles laying ahead, the Government will need to hit the ground running. We take a look at some of the key projections and checkpoints throughout the next term.
Certificate schemes – good for governments, but what about customers?
Retailer certificate schemes have been growing in popularity in recent years as a policy mechanism to help deliver the energy transition. The report puts forward some recommendations on how to improve the efficiency of these schemes. It also includes a deeper dive into the Victorian Energy Upgrades program and South Australian Retailer Energy Productivity Scheme.
2025 Election: A tale of two campaigns
The election has been called and the campaigning has started in earnest. With both major parties proposing a markedly different path to deliver the energy transition and to reach net zero, we take a look at what sits beneath the big headlines and analyse how the current Labor Government is tracking towards its targets, and how a potential future Coalition Government might deliver on their commitments.
Send an email with your question or comment, and include your name and a short message and we'll get back to you shortly.