

by Carl Kitchen
Can the NEM stand the heat?
In recent days the National Electricity Market has probably had its toughest test since the closure of the Hazelwood and Northern coal-fired power stations.
Record heat in South Australia and extreme weather in Victoria last week stretched the capacity of generators, as well as the grid. It saw the Australian Energy Market Operator (AEMO) dispatching the Reliability and Emergency Reserve Trader (RERT) for the second summer in a row, and introducing the administered price cap[ii] onto energy for the first time in a decade. Ultimately, the market operator had to require 200MW of load shedding in Melbourne suburbs and regional Victoria from midday[iii] on Friday 25 January.
The peak days of stress on the system last week were 24 January, particularly in South Australia where Adelaide endured a record temperature of 46.6 degrees C (surpassing the previous highest temperature of 46.2 recorded in 1939 and giving it the mantle of our hottest capital city[iv]). The following day in Victoria, Melbourne’s temperature hit (42.8 degrees C) while regional centres also endured extreme heat.
The measures taken in Victoria followed the loss of firm generating units – one unit at Loy Yang A (tube leak) and two at Yallourn (one because of critical and previously postponed maintenance and another unavailable due to a tube leak). In NSW Liddell lost a unit, while the gas-fired Tallawarra power station was also offline. At the same time there was limited wind and solar supply in Victoria when the peak demand arrived (see table 2).
Demand in SA reached 3020MW (the record peak demand for SA was 3397MW in 2010-11), while in Victoria demand peaked at 9137MW at 11am NEM time[v]. The state’s record peak is 10,490MW reported a decade ago. Prior to summer AEMO had flagged a potential shortfall in Victoria and had secured 130MW of RERT with a further 800MW identified as available at relatively short notice[vi].
Where did the power come from?
So where did SA and Victoria draw their supply from during the periods of peak demand?
The graphs below show the generation by source for SA across the day on 24 January, the spot market prices during the day and the percentage contribution of each type of generation.
Gas was the mainstay for South Australia supplying 70 per cent of all electricity across the day and reaching 82.2 per cent of supply during the peak demand period (see table 1). Wind contributed strongly early in the day before dropping as peak demand was reached. The two batteries, Hornsdale Power Reserve and Dalrymple, supplied up to 46MW of electricity towards the demand peak, until their available stored energy was exhausted. The SA Government’s nine emergency diesel generators put in place after the state endured blackouts in early 2017 were called on to supplement supply and were generating 229MW at 4.30pm (the generators have a nameplate capacity of 276MW). During the SA peak demand at 7:05pm the diesel generators provided 6.9 per cent of the state’s power needs.
Table 1: SA Peak Supply by Generation type, 24 January 2019, 7:05pm NEM Time
|
Solar* |
Wind |
Gas |
Diesel |
Batteries |
Interconnectors |
|
0.4% |
6.9% |
82.2% |
6.9% |
0.0% |
3.6% |
Source: AEC analysis of NEM data. *Excludes roof-top solar (demand reduction).
Figure 1: South Australian Generation by type and average spot price 24 January 2019* NEM time[vii]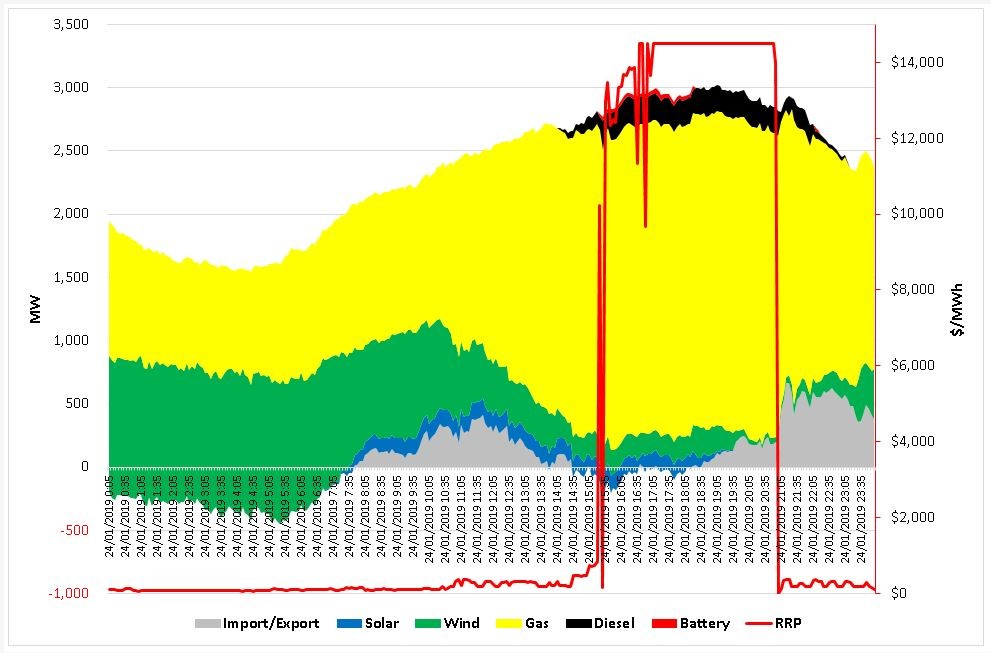 Source: AEC analysis of NEM data. *Exports from SA shown below the line. Excludes roof-top solar (demand reduction).
Given the high demand, and as would be expected, wholesale electricity prices reached the market price cap $14,500/MWh[viii] for several hours in South Australia and Victoria on Thursday and again briefly on Friday before the maximum threshold for the rolling seven-day total was reached. AEMO then introduced administered price caps for SA and Victoria. It is the first time since 2009 that the cumulative price threshold ($216,900 for the 2018-19 financial year, which is equivalent to an average spot price of $645.54/MWh over the previous seven days[ix]) on energy was reached. The administered price caps are a market safety net used to limit prices if market prices in a region rise to levels “which are likely to cause substantial financial stress”[x]. They were more recently used to cap Frequency Control Ancillary Services prices.
Setting the threshold is a difficult challenge – there must be incentive in the market to encourage retailers to contract with reliable peaking generators, but not so much price risk that such an event could cause widespread financial disruption. But the cap itself creates market difficulties if demand continues to be high. Scheduled generators whose operating costs exceed the price cap are entitled to claim compensation from AEMO.
Figure 2: Percentage share by generation type, SA 24 January 2019*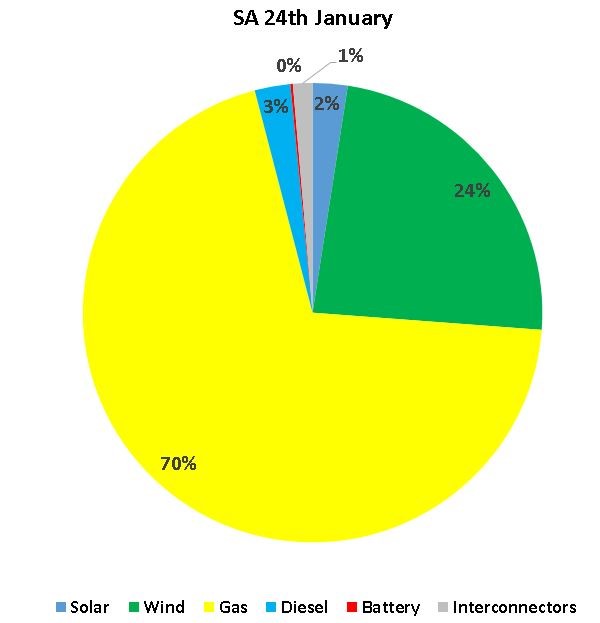
Source: AEC analysis of NEM data; *Excludes roof-top solar (demand reduction).
Across the border in Victoria the following day – coal and gas-fired generation and hydro were the major contributors to meeting electricity needs. Limited wind was available. At the peak, wind supplied 4.8 percent of generation. Supply across the day is shown in figure 3, while supply by generation type at the peak is shown in table 2 (the generation percentage share across the day is illustrated in figure 4).
Figure 3: Victorian Generation and Average Spot Price, 25 January 2019* NEM time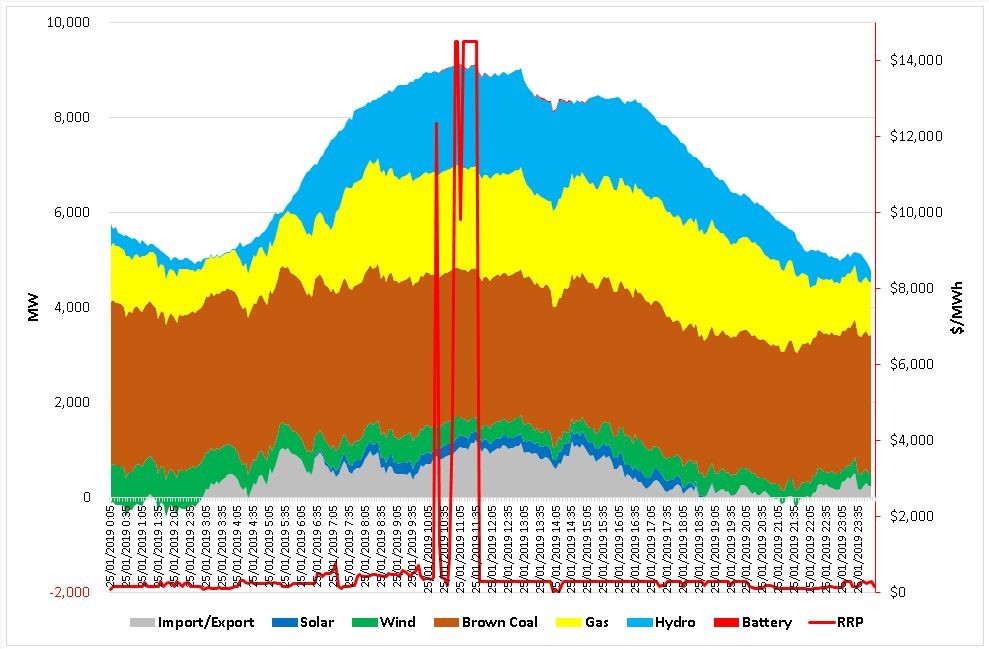 Source: AEC analysis of NEM data. *Exports from Vic shown below the line. Excludes roof-top solar (demand reduction).
Table 2: Vic Peak Supply by Generation type, 25 January 2019, 11am NEM Time
|
Solar* |
Wind |
Brown Coal |
Gas |
Hydro |
Batteries |
Interconnectors |
|
2.7% |
4.8% |
34.3% |
23.6% |
23.4% |
0.1% |
11.2% |
Source: AEC analysis of NEM data. *Excludes roof-top solar (demand reduction).
Figure 4: Percentage share by generation type, Vic 25 January 2019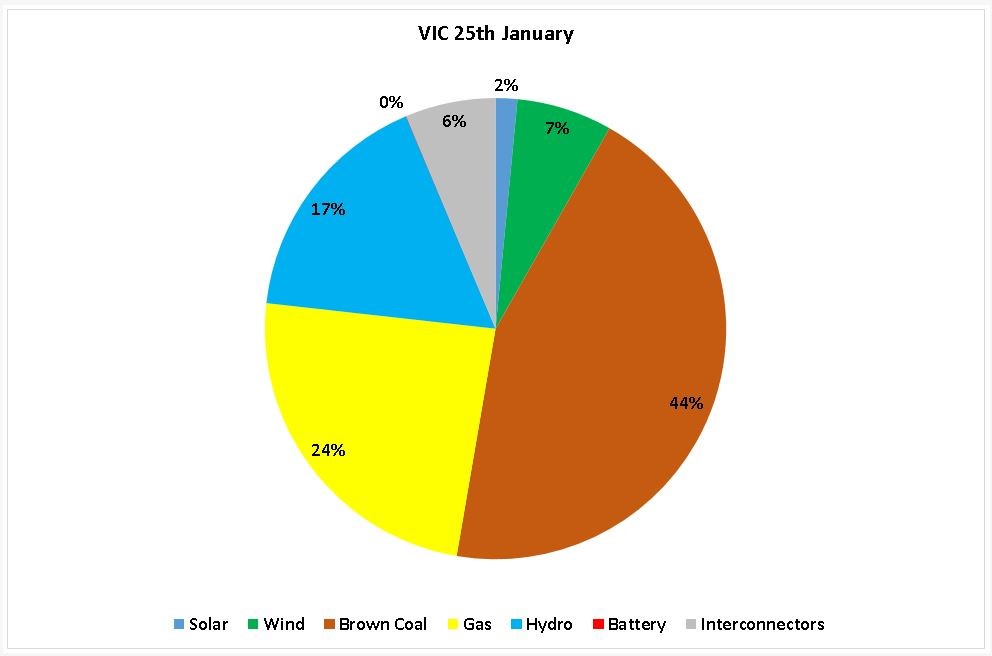 Source: AEC analysis of NEM data. *Excludes roof-top solar (demand reduction).
Load shedding due to generation shortfall is a very unfortunate, but thankfully an extremely rare event and we should always consider it in context. The reliability standard is to keep this below 0.002% of the annual consumption over time. The actual amount of energy shed is not yet available, but it appears to slightly exceed Victoria’s target for 2018-19. However this was the first of this type of load interruption in Victoria since the 2009 heatwave, there was no load shed in other states, and the totals are minor compared to interruptions that occur due to other causes, many of which also occur in hot weather.
With load shedding and high wholesales prices will come attempts to apportion blame or criticism and, in Victoria, calls for compensation[xi]. It also places increased pressure on retailers, who are also currently under pressure from the Federal Government to keep prices down[xii]. But the tight supply situation is not the fault of the market operator, or the generators, or renewable technologies. It is a combination of unfortunate circumstances, but not helped by more than a decade of political deadlock over climate and energy policy. The investment signals that may have triggered the building of extra firm capacity have been suppressed over a long period by the lack of policy certainty. It will now take time to address, but we should also not over-react with further interventions.
Operationally the energy companies along with the regulators operating the system are doing what they can to prevent the system being overwhelmed during the peak demand summer period. Undoubtedly, it will remain an issue of intense public focus.
[i] Note all times quoted in this article are NEM times which is based on Australian Eastern Standard Time and not Australian Eastern Daylight Time (daylight saving) so to get a daylight time add one hour.
[ii] https://www.aemo.com.au/-/media/Files/Electricity/NEM/Security_and_Reliability/Dispatch/Policy_and_Process/2018/Operation-of-the-administered-price-provisions-in-the-national-electricity-market.pdf
[iii] http://energylive.aemo.com.au/News/Victorian-energy-supply---update
[iv] https://www.abc.net.au/news/2019-01-24/sa-heating-up-with-records-expected-to-be-broken/10745220
[v] NEM time is based on Australian Eastern Standard Time and not Australian Eastern Daylight Time, so in this case the peak occurred at midday daylight saving time. All times quoted in this article are NEM times and to get a daylight saving time you need to add one hour.
[vi] AEMO Summer 2018-19 Readiness Plan, November 2018
[vii] NEM time is based on Australian Eastern Standard Time and not Australian Eastern Daylight Time.
[vii] NEM time is based on Australian Eastern Standard Time
[viii] As required by the National Electricity Rules, AEMO must set the price at the Market Price Cap of $14,500 when demand exceeds market based supplies
[ix] https://www.aemo.com.au/-/media/Files/Electricity/NEM/Security_and_Reliability/Dispatch/Policy_and_Process/2018/Operation-of-the-administered-price-provisions-in-the-national-electricity-market.pdf
[x] https://www.aemo.com.au/-/media/Files/Electricity/NEM/Security_and_Reliability/Dispatch/Policy_and_Process/2018/Operation-of-the-administered-price-provisions-in-the-national-electricity-market.pdf
[xi] https://www.abc.net.au/news/2019-01-26/victorian-blackouts-what-caused-them-and-is-this-the-new-normal/10751412
[xii] Spikes in prices spark fears for power retailers, Australian Financial Review, 30 January 2019
Related Analysis
Retail protection reviews – A view from the frontline
The Australian Energy Regulator (AER) and the Essential Services Commission (ESC) have released separate papers to review and consult on changes to their respective regulation around payment difficulty. Many elements of the proposed changes focus on the interactions between an energy retailer’s call-centre and their hardship customers, we visited one of these call centres to understand how these frameworks are implemented in practice. Drawing on this experience, we take a look at the reviews that are underway.
Data Centres and Energy Demand – What’s Needed?
The growth in data centres brings with it increased energy demands and as a result the use of power has become the number one issue for their operators globally. Australia is seen as a country that will continue to see growth in data centres and Morgan Stanley Research has taken a detailed look at both the anticipated growth in data centres in Australia and what it might mean for our grid. We take a closer look.
Green certification key to Government’s climate ambitions
The energy transition is creating surging corporate demand, both domestically and internationally, for renewable electricity. But with growing scrutiny towards greenwashing, it is critical all green electricity claims are verifiable and credible. The Federal Government has designed a policy to perform this function but in recent months the timing of its implementation has come under some doubt. We take a closer look.
Send an email with your question or comment, and include your name and a short message and we'll get back to you shortly.